


Did the Government Shutdown Help the Economy?
Date Posted: December 6, 2013
Read time: 46 min
By Frank Holmes
CEO and Chief Investment Officer
U.S. Global Investors
From New Delhi to San Francisco to London, and finally back in San Antonio, I’ve been communicating one consistent theme to investors: Follow the money.
What’s really important in following the money is for investors to not get caught up in the negative web spun by the media. There’s a lot of drama these days about Obamacare and Washington dysfunction. Take the government shutdown in October, when the House and Senate fought over the debt ceiling. Economic data wasn’t released, services were halted, national parks were closed, and “non-essential” government workers were told to stay home.
As a result, GDP was expected to collapse.
Yet, data released this week reveal a different, stronger image of the U.S. economy. I think Shakespeare would deem the media’s fear mongering tactics as “Much Ado About Nothing.”
Third-quarter GDP growth was recently revised to 3.6 percent, much higher than the estimated 2.8 percent figure. In November, more jobs were created and the unemployment rate fell to 7 percent. Not a spectacular result, but better than expected.
Perhaps people are gaining confidence in the U.S. economy, as figures show a buying spree in large purchases of new homes and vehicles.
In October, U.S. new home sales rebounded from a one-year low. According to Bloomberg, sales increased more than 25 percent, despite “this year’s increase in borrowing costs and property values.” As a “sign of growing momentum” for the housing market, applications for building permits also climbed to a five-year high, says Bloomberg.
Many garages will be filled with new cars and more expensive trucks and sport utility vehicles, as 16 million automobiles were sold in November, the fastest pace since February 2007, according to Autodata. American automobile makers “drove the blistering sales month,” with General Motors sales growing nearly 14 percent and Chrysler sales increasing 16 percent in November, says USA Today.
These facts support what we’ve been seeing in the U.S. purchasing manager’s index (PMI), which climbed to a ten-month high in November. Generally, PMIs are a leading indicator of future economic trends.
So, we shouldn’t hope for a government shutdown again … or should we?
Here’s a Simple Way to Follow the Money: Look for the leaders and understand the laggards. Here’s a chart showing the top sector performance among the S&P 500 Index since January. With the revolution occurring in the health care industry, the sector has seen an incredible 40 percent increase, closely followed by consumer discretionary. Industrials stocks, which rose about 35 percent, have gotten a boost from PMI’s jumper cables.
Meanwhile, defensive areas such as telecommunications and utilities have lagged, as rising interest rates have made these defensive companies’ dividend yields less desirable.

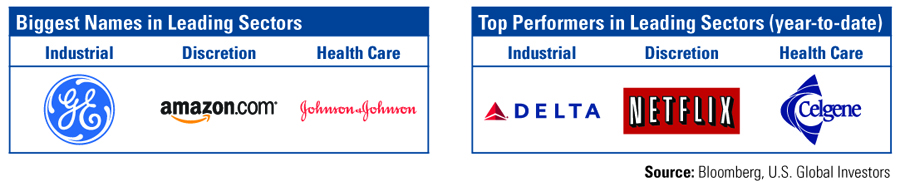
To get an idea of the companies held in each of these sectors, the following are the largest stocks in terms of market capitalization: In industrials, General Electric (GE) is the biggest; in consumer discretionary, Amazon (AMZN) takes the lead; and in health care, it’s Johnson & Johnson (JNJ).
On a year-to-date basis, in industrials, airlines such as Delta (DAL), have taken off. Among discretionary stocks, Netflix (NFLX) is the leader, and within the health care sector, biotechnology companies, such as Celgene (CELG), have increased the most.
Ranking sectors and stocks this way, it’s easy to follow the leaders. It’s like Newton’s First Law of Motion: once in motion, these stocks tend to stay in motion.
We’ve applied this top-down strategy to the MegaTrends Fund (MEGAX), helping the fund outperform its Lipper peers with less risk over the last year.

See complete fund performance here.
In other words, over this time period, the fund is in “Seattle.”
In the investment business, we often chart funds on a matrix of risk and return. The top left quadrant offers the greatest return for less risk, which is where you want your investments to be. If you imagine the matrix as a map of the U.S., you’d want your portfolio to land in “Seattle.”
The bottom right quadrant is where an investment has produced below-average returns with above-average risk. In our map analogy, you don’t want to find your portfolio in “Miami.”
While the MegaTrends Fund utilizes a macro-driven, proprietary strategy to identify sectors, the Holmes Growth Fund (ACBGX) uses what we call the “10-20-20 Model.” The stock-picking process is dynamic and focuses on companies growing revenues at 10 percent, generating a 20 percent earnings growth rate and a 20 percent return-on-equity. As you can see below, over the past year, the fund has increased more than its peers with slightly more risk.

See complete fund performance here.
We recently recommended to shareholders that the investment objective and strategies of these two funds be merged. The merger is subject to the approval of MegaTrends Fund shareholders at a shareholder meeting on December 20.
U.S. Global Investors’ third U.S. equity-focused fund, the All American Equity Fund (GBTFX), also landed in “Seattle” over the one-year period.

See complete fund performance here.
Will the Domestic Bull Run Continue?
The synchronized global recovery continues to take place. Just this week, Japan announced additional fiscal stimulus. In addition, China continues to grow, with sweeping economic reforms taking place, and Europe is expected to recover. Further, based on fund flows of investors selling their bonds and buying equities, we expect this trend to continue for a while. As I often say, trying to stop a bull market has risks, so follow the money.
Saying Goodbye to a Prince of Peace
Yesterday, the world lost one of our heroes. There are so few people in this world who have fought for freedom in such a benevolent way as Nelson Mandela.
I’m humbled to have met the former president of South Africa at a leadership event years ago and what impresses me to this day was his kind and compassionate spirit. While he could have led with resentment and bitterness, he chose to be peaceful, taking the baton from F.W. de Klerk to unify South Africa. For their efforts, both men were awarded the Nobel Peace Prize 1993 for peacefully terminating the Apartheid regime and laying the foundations for a democratic nation.
Nelson Mandela was truly the model of peace and prosperity, and will be revered as much as we admire Mahatma Gandhi and Mother Theresa. For future generations, he is a reminder that some individuals truly have the capacity to change the world.
John Derrick, CFA, director of research, contributed to this commentary.

Index Summary
- Major market indices finished mostly flat this week. The Dow Jones Industrial Average fell 0.41 percent. The S&P 500 Stock Index fell 0.04 percent, while the Nasdaq Composite advanced 0.06 percent. The Russell 2000 small capitalization index fell 1.01 percent this week.
- The Hang Seng Composite fell 0.58 percent; Taiwan lost 0.47 percent while the KOSPI dropped 3.15 percent. The 10-year Treasury bond yield rose 11 basis points this week to 2.86 percent.
November 27, 2013Frank Holmes on Gold and Oil |
November 27, 2013Ways to Play Commodities |
December 2, 2013The Merits of Fracking with Frank Holmes |
Domestic Equity Market
The S&P 500 Index was essentially flat for the week as the market rallied on Friday, closing the gap for the week. The market climbed more than one percent on Friday as nonfarm payrolls grew by 203,000, likely continuing the “goldilocks” scenario of growth that is not too strong to invoke action from the Fed but not too weak to endanger the continuing economic recovery.
Strengths
- The utility sector was the best performer this week, led by NRG Energy, Exelon and AES.
- Technology stocks were also notable performers, led by data storage companies Western Digital and Seagate Technology, along with household names such as Intel and Yahoo.
- Forest Laboratories was the best performer in the S&P 500 this week, rising 10.91 percent. The company announced a significant restructuring to streamline operations and reduce costs. The company also announced that it would leverage the balance sheet and return cash to shareholders through share repurchases.
Weaknesses
- The telecom sector was the worst performer this week as AT&T fell nearly 2 percent.
- The consumer discretion sector also fell this week with numerous retailers reporting disappointing November sales as price competition remains intense.
- Teradata was the worst performer in the S&P 500 this week, falling 8.24 percent. A major sell side firm downgraded the IT hardware space as cloud computing continues to be a disruptive force for the industry. The company is a data storage provider and the concern is that revenue is at risk.
Opportunities
- The current macro environment remains positive as economic data appears robust enough to give investors confidence in an economic recovery but not too strong as to force the Fed to change course in the near term.
- Money flows are likely to find their way into domestic U.S. equities and out of bonds and emerging markets.
- The improving macro backdrop out of Europe and China could be the catalyst for a rally into the year end.
Threats
- A market consolidation could occur in the near term after such strong performance year-to-date.
- Higher interest rates are a threat for the whole economy. The Fed must walk a fine line and the potential for policy error is large.

U.S. Government Securities Savings Fund – UGSXX • U.S. Treasury Securities Cash Fund – USTXX
Near-Term Tax Free Fund – NEARX • Tax Free Fund – USUTX
Near-Term Tax Free Fund – NEARX • Tax Free Fund – USUTX
The Economy and Bond Market
Treasury bond yields rose this week as economic data continues to improve, increasing the odds the Fed begins tapering its quantitative easing program as soon as this month. The ISM manufacturing index rose to the highest level in more than two years, confirming strength in similar indicators from around the world. Nonfarm payrolls for November were also better than expected, continuing to show some modest improvement, which will likely increase the Fed’s comfort that the economy is on the mend.

Strengths
- The ISM manufacturing index rose to the highest level in more than two years. The European Union Markit PMI also hit the highest level since June 2011.
- The unemployment rate fell to 7.0 percent as nonfarm payrolls grew 203,000 in November.
- Auto sales remain strong in November as General Motors’ sales rose 14 percent, Ford’s sales rose 7 percent and Chrysler’s sales rose 16 percent. On an annualized basis, this was the best month since February 2007.
Weaknesses
- Retail sales for November have so far disappointed, with price competition intense, making for a more difficult holiday sales season than expected.
- Factory orders for October fell 0.9 percent.
- Brazil’s economy contracted 0.5 percent in the third quarter as bureaucracy, high taxes, and inflation weigh on the economy.
Opportunities
- Despite recent conflicting commentary, the Fed continues to remain committed to an overall accommodative policy and is unlikely to raise interest rates in 2014.
- Key global central bankers remain in easing mode such as the European Central Bank (ECB), Bank of England and the Bank of Japan. Japan announced a $54 billion fiscal stimulus plan aimed at revitalizing infrastructure.
- There remain many moving parts to the taper decision and it is very possible that tapering could be delayed well into 2014.
Threats
- Inflation in some corners of the globe is getting the attention of policy makers and may be an early indicator for the rest of the world.
- Trade and/or currency “wars” cannot be ruled out which may cause unintended consequences and volatility in the financial markets.
- The recent bond market sell off may be a “shot across the bow” as the markets reassess the changing macro dynamics.

World Precious Minerals Fund – UNWPX • Gold and Precious Metals Fund – USERX
Gold Market
For the week, spot gold closed at $1,229.05, down $24.44 per ounce, or 1.95 percent. Gold stocks, as measured by the NYSE Arca Gold Miners Index, declined 7.01 percent. The U.S. Trade-Weighted Dollar Index lost 0.45 percent for the week.
Strengths
- The Chinese yuan overtook the euro to become the second-most used currency in global trade finance in 2013. China is publicly seeking a greater role for its currency in global trade and investment as the state relaxes controls on the exchange rate, fund flows, and borrowing costs. The increase in volume traded was partly a result of agreements announced this quarter to start direct currency trading between the yuan and both the British pound and Singapore dollar. The announcement bodes well for gold in the long term as the People’s Bank of China is likely to continue strengthening its foreign reserves with gold, which will give a stronger backing to the Asian nation’s currency and increase its relevance in global trade finance.
- A report in a major Canadian newspaper highlighted new technological developments taking place in the gold sector which are expected to enhance operational efficiency. Rick Howes, CEO of Dundee Precious Metals, received a call on his personal iPhone while in a deep underground tunnel at the company’s Bulgarian gold mine. The installation of a data network puts Dundee at the forefront of the industry’s next phase, treating mines as just-in-time manufacturing sites, according to the news. CEOs of some of the largest mining companies in the world have made presence on site to learn whether their companies can adopt the data and communications technologies for their own operations.
- Pretium Resources released a total of 95 intercepts from 46 holes drilled into the Valley of the Kings (VOK) zone. The intercepts returned a weighted average grade of 24.8 grams per tonne gold. Management noted the underground drilling has expanded the high-grade mineralization of the VOK to the east, and mineralization remains open in all directions. Reservoir Minerals released assay results for five diamond drill holes at the Cukaru Peki target on the Timok joint venture with Freeport-McMoRan in Serbia. According to Scotiabank analysts, the new infill holes have increased the size of the resource by 22 percent more than their initial estimates.
Weaknesses
- Gold broke through support levels at $1,235 and at $1,225 earlier in the week to make new intraday lows before closing the week at $1,229. During the week, in aftermarket hours, gold made a low of $1,218 before Asian physical buyers stopped the fall. Despite Shanghai physical premiums having picked up, the size of the short positions has increased, and there is a “distinct lack of more broad based appeal for gold at the moment,” according to Scotiabank. UBS lowered its 2014 average gold price from $1,325 to $1,200, adding that it expects weaker prices as the market fluctuates in the crosscurrents of an improving macro backdrop.
- Gold sales from Australia’s Perth Mint, the main bullion refiner in the world’s second-biggest producer, decreased last month as prices declined for a third month. Sales of coins and minted bars fell 32 percent to 52,700 ounces in November from 77,255 in October. Similarly, silver sales were 807,246 ounces in November from 821,580 ounces in October. The U.S. Mint saw a slight decline in the sale of American Eagle coins in November, equaling 48,000 ounces, compared to the 48,500 ounces sold in October.
- Colossus Minerals announced its efforts to secure additional financing have been unsuccessful, and the board of directors has taken a decision that the company’s strategy should be reviewed. To achieve that purpose, the company will cease underground development for the time being and focus on de-risking the project. According to Joseph Fazzini of Dundee Capital Markets, it is evident that the decision to de-risk the project comes too late for any significant benefit to be realized in the short term. With the funding shortfall, a change in strategic direction and no imminent path to production, we believe the risk of holding Colossus exceeds the potential rewards.
Opportunities
- A Bloomberg article stated that John Thornton, who is set to become Barrick Gold’s Chairman at the next annual general meeting, is trying to establish partnerships with Chinese companies that may include investment in Barrick and future mining projects as part of his review of the largest gold producer’s long-term strategy. According to Thornton, Barrick is set to benefit by forming relationships with Chinese companies that can provide capital, engineering expertise and political influence.
- One too many of the investors and analysts we speak to on a daily basis is completely oblivious to the recent behavior of the U.S. dollar. The recent macroeconomic data released has helped propel the equity markets higher, based on the notions that (1) the recovery is in full swing and (2) the labor, manufacturing, and economic releases are at multi-year highs. One would expect that the taper talk 2.0 which has followed recent macroeconomic data releases would have the U.S. dollar flying high. But as the chart above shows, the exact opposite has happened. In fact, despite the calls for December tapering piling up on the basis of visible improvements to the labor market, the U.S. dollar has failed to respond. The U.S. dollar trades in the foreign exchange market, which transacts well over $4 trillion on average per day, making it the most liquid market, and clearly one where any type of manipulation is nearly impossible. The interpretation we give to this is that the U.S. dollar weakness signals tapering is unlikely in the short term, and a continuation of the U.S. dollar downtrend is likely. These developments should bode well for gold going into the new year as we expect the historic negative correlation between gold and the U.S. dollar to gain momentum.
- On Monday, David Rosenberg had a short, yet very interesting analysis of up-and-coming inflation in 2014. In his daily write-up for Gluskin Sheff, Rosenberg opines that labor will be the recipient of the income spoils in 2014, which will bring labor inflation up, by “hook or by crook.” He adds that a depleted pool of available labor, evidenced by the low labor participation rate, and new multi-year highs on most measures of labor demand will result in accelerating wage pressure. In addition, minimum wages are poised to rise across the U.S., but this time with more force following the momentum brought by the hiking of minimum wage rates to $15 dollars in a Washington state county.
Threats
- Barclays estimates mining companies will hedge a net 10 tons of gold in 2014, after having bought back 30 tons this year. Despite Barclays’ belief that “large-scale hedging is likely to be limited, given the time and money invested in unwinding positions and in light of continued shareholder preference for exposure to the underlying price,” some executives at the major gold producers insist on the benefits of hedging. Barrick Gold’s Chairman-elect Thornton told reporters this week, “I always thought it made great sense to hedge,” while Charles Carter, an executive vice president at AngloGold Ashanti, said the industry will “slowly return” to forward sales. It is curious both Barrick and AngloGold are optimistic on hedging since the two companies have been some of the greatest offenders when it came to hedging in the past, with Barrick having borrowed heavily, to pay at least $5.6 billion in 2009 to get out of hedging contracts.
- BMO mining analysts are predicting gold stocks are likely to come under heavy year-end tax-loss selling. Two circumstances will make the tax-loss selling particularly damaging this year: not only have gold stocks underperformed dramatically over the course of the year, but the broader equity markets also have been abnormally strong, increasing the incentive for taking advantage of tax-loss selling into the new year.
- According to Mark Bristow, CEO of Randgold Resources, the fact that share prices of many of the world’s top gold companies are at or below the levels at which they traded in 2002, is a sad indictment of an industry that has lived from quarter to quarter, rather than planning for the future. Bristow added that the gold sector can deliver value, yet most of the players in the gold industry have “failed to take advantage of the biggest bull market we have ever experienced.” Bristow concluded by stating that “the industry has been unable to replace even half of the gold it has mined in the past decade,” which doesn’t paint a pretty picture for the industry going forward.

Energy and Natural Resources Market

Strengths
- The price of natural gas gained 4 percent this week, breeching $4 per Mmbtu for the first time in six months, as colder temperatures across the country increased demand for the heating fuel.
- West Texas crude oil made its biggest weekly advance since this summer, as the U.S. jobless rate dropped to a five-year low and consumer confidence rose the most in five months, signaling a brighter economic outlook and stronger demand growth.
- November’s manufacturing PMIs, indicators of manufacturing output growth, painted a picture of accelerating expansion in most developed economies and stable but solid growth in China. Some other emerging markets were less positive, but on the whole the global manufacturing rally continues.
- Coal exports from South Africa’s Richards Bay Coal Terminal were relatively strong in November, at 75.7mt annualized, of which shipments to Europe were at their highest level since January 2010.

Weaknesses
- BHP Billiton reportedly is offering January pricing for coking coal at $143 per metric ton, $7 lower than the prior month. This figure compares to the 2013 fourth quarter benchmark price of $152 per ton and a current spot quote of $136/t fob.
- U.S. raw steel production fell 2.1 percent to 1.812 million tonnes in the week ended November 30, according to the American Iron and Steel Institute.
Opportunities
- Barrick Gold’s new Chairman, John Thornton, is considering revisiting the company’s gold hedging strategy, stunning some investors who are invested in the company as they see a bright future for gold prices. Also, his plan for more diversification into other commodities drew criticism from some investors.
- There is further support for domestic steel pricing as U.S. steel import permits fell 17 percent in November. Steel import applications fell 17 percent month-over-month to 2.54 million tons in November, compared to October imports of 3.06 million tons.
- Vale said the global iron-ore supply capacity is expected to be at 1.7 billion tones by 2020 and iron ore shipments are likely to be 321 million tones next year.
Threats
- Chinese steel profitability over the past two months has gone negative while iron ore prices have held steady. Optimism about the Chinese New Year restocking on stronger steel demand over the next two months is probably the key reason. However, even in a scenario where this happens, it sets up for price weakness once the New Year is over.
- Indonesia’s domestic mining industry could be dead if the government goes ahead with the proposed ban on ore exports from 2014, said a domestic miners’ association, arguing the ban favors foreign firms like Freeport-McMoRan and Newmont Mining that can more easily adapt to the new rules.

China Region Fund – USCOX • Emerging Europe Fund – EUROX
Emerging Markets
Strengths
- Hungary’s third quarter GDP rose 1.8 percent from a year earlier, according to data published by the Central Statistics Office. Similarly, retail sales in the Eastern European country rose 2.5 percent from last year in October, beating analysts’ estimates. The rise in retail sales is a result of improved consumer confidence, low inflation and a hike in some public employment wages. Retail sales could continue to increase as recent utilities price cuts leave households with more disposable income.
- Poland will raise approximately $780 million from the sale of a stake in utility Energa SA, marking Central Europe’s largest initial public offering in two years. The sale will help the government increase revenue from asset sales which, over the last five years, have helped the country gain funds for financing the budget deficit and curbing public debt growth.
- The China Politburo meeting on Tuesday was reportedly to study the economy and to maintain economic stability and implement reform plans. It was heard that the meeting discussed providing supports to the shipping industry. The market is currently waiting for more details on the implementation of reform plans in the upcoming annual Economic Works Conference in mid-December. Also in the week, China announced that it would resume initial public offerings and start preferred shares issuance, which was seen as positive for brokers, insurance companies and banks. China issued three 4G licenses to the three telecom companies in China, which will benefit smart phone makers and e-commerce due to phone switch and faster download time. China’s Ministry of Commerce said that China is implementing 18 free trade zones at the moment. The Ministry of Finance announced on Monday to extend an existing tax exemption on imported LNG and imported pipeline gas effectively immediately to support gas supplies in the winter season. China natural gas consumption is an organic growth opportunity for investors.
- China’s November official PMI was 51.4 versus the estimate of 51.1, indicating the economy maintained expansionary strength.
- Macau gaming revenues were up 21.3 percent year-over-year in November versus the consensus of 18 percent.
- Thailand’s current account deficit was reduced to $0.9 billion in the third quarter, compared with a bigger current account deficit of $6.7 billion in the second quarter. Thailand’s November CPI was 1.92 percent, slightly higher than the consensus of 1.82 percent and October’s 1.46 percent, leaving room for the central bank to maintain an accommodative monetary policy.
- Indonesia managed to produce a trade surplus of $50 million compared to economists’ expectation of a $775 million deficit. Indonesia inflation was also stabilized as November CPI was 8.37 percent versus the consensus of 8.45 percent.
Weaknesses
- The Brazilian economy contracted 0.5 percent in the third quarter, missing analysts’ estimates, in what marked the worst performance since the first quarter of 2009. On a year-over-year period, Brazil’s economic growth slowed to 2.2 percent. The consumer-led growth model of the last decade has proven insufficient to support growth for another decade, in spite of spending incentives by government-subsidized credit. On the other hand, investment contribution to growth is low, at just 19 percent of GDP, as opposed to the emerging-market benchmark of around 25 percent.
- The Czech economy shrank in the third quarter, marking a seventh consecutive contraction. The main detractor was exports which fell before the central bank started a campaign to devalue the currency. GDP declined 1.3 percent from a year earlier. The economy is struggling to return to growth after three years of government austerity and lower demand for Czech exports.
- China will expand a resource tax to coal, according to the National Development and Resource Commission.
- The China Politburo meeting on Tuesday was said to keep property curbs.
- The announcement of IPO resumption in China caused Chinext index, a domestic GEM board, to drop 8.3 percent on Monday as the market was concerned about potential liquidity tightness.
- The Indonesian government will proceed with the plan to ban all mineral ore exports in 2014 in accordance with the new mining law. Although it doesn’t help reduce the current account deficit, it does help the global mineral ore price.
- Korea November exports slowed, rising only 0.2 percent, below the consensus of 3 percent year-over-year increase, on weak exports to Association of Southeast Asian Nations and Japan. Imports were down 0.6 percent versus the consensus for a 4.4 percent increase.
Opportunities

- In the short term, Turkey will continue to show vulnerability to higher U.S. interest rates due to its large external financing needs; however, the long-term prospects for the economy are among the more favorable in the emerging world. Deutsche Bank strategists believe the Eastern European country is well placed to ascend the rankings of the world’s largest economies over the next 15 years, as shown on the chart above. Aided by a young and growing population, a well-diversified exports sector, and relatively low levels of public and private leverage, the Turkish economy is set to potentially overtake Spain, Canada, and Italy to become the world’s thirteenth largest economy as measured by purchasing power parity.
- India’s stocks outperformed this week as an exit poll showed the opposition Bharatiya Janata Party is set to win four of five state elections held in the past month. The speculation that state election results this weekend will confirm gains for the nation’s main opposition party, and its Prime Minister candidate Narendra Modi, will give Modi momentum ahead of national voting next year. Modi’s popularity stems from his tenure as Chief Minister of Gujarat, where he has overseen annual economic growth of 10 percent on average for his state.

- As shown in the chart above, Macau gaming revenue growth had rebounded from the recent bottom in July 2012 when the Bo Xilai scandal had caused growth to decline. Analysts expect Macau’s gaming sector to sustain double-digit growth until 2017.
Threats
- Russia’s Economic Ministry officially downgraded the country’s GDP growth rate for 2013 and 2014. According to the Kremlin, economic growth for 2013 is now expected to reach only 1.4 percent, compared to the previous 1.8 percent, and 2014 growth has been cut by 50 basis points to 2.5 percent, significantly below the global economic growth of roughly 3.5 percent. According to JP Morgan analysts, the problem going forward is that state monopolies have been asked to cut annual expenditures by 10 percent through 2018, arguably to preserve the dividend upon which the Russian fiscal budget is reliant. The result of state monopolies cutting annual expenditures is that they would result in lower employment given they are the country’s largest employers, which would in turn result in lower consumer spending, and subsequent hits to GDP.
- Thailand’s political turmoil might aggravate the slowdown of the economic growth should the current government collapse. Also business activities slowed, such as tourism during the protest in November. The market had hoped the King’s birthday celebration would help interrupt the protesters’ enthusiasm.
Leaders and Laggards
The tables show the weekly, monthly and quarterly performance statistics of major equity and commodity market benchmarks of our family of funds.
| Index | Close | Weekly Change($) |
Weekly Change(%) |
|---|---|---|---|
| DJIA | 16,020.20 | -66.21 | -0.41% |
| S&P 500 | 1,805.09 | -0.72 | -0.04% |
| S&P Energy | 632.93 | +0.27 | +0.04% |
| S&P Basic Materials | 278.36 | -0.52 | -0.19% |
| Nasdaq | 4,062.52 | +2.64 | +0.06% |
| Russell 2000 | 1,131.38 | -11.51 | -1.01% |
| Hang Seng Composite Index | 3,310.65 | -18.33 | -0.55% |
| Korean KOSPI Index | 1,980.41 | -64.46 | -3.15% |
| S&P/TSX Canadian Gold Index | 150.96 | -10.65 | -6.59% |
| XAU | 80.80 | -5.66 | -6.55% |
| Gold Futures | 1,228.30 | -22.10 | -1.77% |
| Oil Futures | 97.70 | +4.98 | +5.37% |
| Natural Gas Futures | 4.13 | +0.17 | +4.35% |
| 10-Yr Treasury Bond | 2.86 | +0.11 | +4.04% |
| Index | Close | Monthly Change($) |
Monthly Change(%) |
|---|---|---|---|
| DJIA | 16,020.20 | +401.98 | +2.57% |
| S&P 500 | 1,805.09 | +42.12 | +2.39% |
| S&P Energy | 632.93 | +2.03 | +0.32% |
| S&P Basic Materials | 278.36 | +3.06 | +1.11% |
| Nasdaq | 4,062.52 | +122.66 | +3.11% |
| Russell 2000 | 1,131.38 | +27.79 | +2.52% |
| Hang Seng Composite Index | 3,310.65 | -332.01 | -14.83% |
| Korean KOSPI Index | 1,980.41 | -33.52 | -1.66% |
| S&P/TSX Canadian Gold Index | 150.96 | -24.23 | -13.83% |
| XAU | 80.80 | -12.48 | -13.38% |
| Gold Futures | 1,228.30 | -80.70 | -6.17% |
| Oil Futures | 97.70 | +4.33 | +4.64% |
| Natural Gas Futures | 4.13 | +0.66 | +19.04% |
| 10-Yr Treasury Bond | 2.86 | +0.19 | +6.93% |
| Index | Close | Quarterly Change($) |
Quarterly Change(%) |
|---|---|---|---|
| DJIA | 16,020.20 | +1,097.70 | +7.36% |
| S&P 500 | 1,805.09 | +149.92 | +9.06% |
| S&P Energy | 632.93 | +29.82 | +4.94% |
| S&P Basic Materials | 278.36 | +20.11 | +7.79% |
| Nasdaq | 4,062.52 | +402.51 | +11.00% |
| Russell 2000 | 1,131.38 | +101.83 | +9.89% |
| Hang Seng Composite Index | 3,310.65 | +202.45 | +6.51% |
| Korean KOSPI Index | 1,980.41 | +25.10 | +1.28% |
| S&P/TSX Canadian Gold Index | 150.96 | -44.52 | -22.77% |
| XAU | 80.80 | -22.21 | -21.56% |
| Gold Futures | 1,228.30 | -159.00 | -11.46% |
| Oil Futures | 97.70 | -12.83 | -11.61% |
| Natural Gas Futures | 4.13 | +0.60 | +16.88% |
| 10-Yr Treasury Bond | 2.86 | -0.08 | -2.69% |
Please consider carefully a fund’s investment objectives, risks, charges and expenses. For this and other important information, obtain a fund prospectus by visiting www.usfunds.com or by calling 1-800-US-FUNDS (1-800-873-8637). Read it carefully before investing. Distributed by U.S. Global Brokerage, Inc.
An investment in a money market fund is neither insured nor guaranteed by the Federal Deposit Insurance Corporation or any other government agency. Although the fund seeks to preserve the value of your investment at $1.00 per share, it is possible to lose money by investing in the fund.
All opinions expressed and data provided are subject to change without notice. Some of these opinions may not be appropriate to every investor.
Foreign and emerging market investing involves special risks such as currency fluctuation and less public disclosure, as well as economic and political risk. By investing in a specific geographic region, a regional fund’s returns and share price may be more volatile than those of a less concentrated portfolio.
The Emerging Europe Fund invests more than 25 percent of its investments in companies principally engaged in the oil & gas or banking industries. The risk of concentrating investments in this group of industries will make the fund more susceptible to risk in these industries than funds which do not concentrate their investments in an industry and may make the fund’s performance more volatile.
Because the Global Resources Fund concentrates its investments in a specific industry, the fund may be subject to greater risks and fluctuations than a portfolio representing a broader range of industries.
Gold, precious metals, and precious minerals funds may be susceptible to adverse economic, political or regulatory developments due to concentrating in a single theme. The prices of gold, precious metals, and precious minerals are subject to substantial price fluctuations over short periods of time and may be affected by unpredicted international monetary and political policies. We suggest investing no more than 5 percent to 10 percent of your portfolio in these sectors. Investing in real estate securities involves risks including the potential loss of principal resulting from changes in property value, interest rates, taxes and changes in regulatory requirements.
Tax-exempt income is federal income tax free. A portion of this income may be subject to state and local income taxes, and if applicable, may subject certain investors to the Alternative Minimum Tax as well. Each tax free fund may invest up to 20 percent of its assets in securities that pay taxable interest. Income or fund distributions attributable to capital gains are usually subject to both state and federal income taxes. Bond funds are subject to interest-rate risk; their value declines as interest rates rise. The tax free funds may be exposed to risks related to a concentration of investments in a particular state or geographic area. These investments present risks resulting from changes in economic conditions of the region or issuer.
Past performance does not guarantee future results.
Standard deviation is a measure of the dispersion of a set of data from its mean. The more spread apart the data, the higher the deviation. Standard deviation is also known as historical volatility.
These market comments were compiled using Bloomberg and Reuters financial news.
Holdings as a percentage of net assets as of 9/30/13:
General Electric Co.: All American Equity Fund, 0.98%
Amazon.com, Inc.: MegaTrends Fund, 1.88%
Johnson & Johnson: 0.0%
Delta Air Lines, Inc.: 0.0%
Netflix, Inc.: 0.0%
Celgene Corp.: All American Equity Fund, 1.49%; MegaTrends Fund, 1.59%
NRG Energy, Inc.: 0.0%
Exelon Corp.: All American Equity Fund, 0.98%
The AES Corp.: 0.0%
Western Digital Corp.: 0.0%
Seagate Technology plc: All American Equity Fund, 1.40%
Intel Corp.: 0.0%
Yahoo! Inc.: 0.0%
Forest Laboratories, Inc.: 0.0%
AT&T, Inc.: All American Equity Fund, 1.18%
Teradata Corp.: 0.0%
General Motors Co.: 0.0%
Ford Motor Co.: MegaTrends Fund, 1.88%
Dundee Precious Metals, Inc.: Emerging Europe Fund, 1.47%; Global Resources Fund, 0.58%; Gold and Precious Metals Fund, 6.10%; World Precious Minerals Fund, 3.74%
Pretium Resources, Inc.: Global Resources Fund, 0.84%; World Precious Minerals Fund, 1.46%
Reservoir Minerals, Inc.: World Precious Minerals Fund, 0.20%
Colossus Minerals, Inc.: 0.0%
AngloGold Ashanti Ltd: Gold and Precious Metals Fund, 0.05%; World Precious Minerals Fund, 0.05%
Randgold Resources Ltd: Global Resources Fund, 1.97%; Gold and Precious Metals Fund, 1.81%; World Precious Minerals Fund, 1.13%
BHP Billiton plc: Global Resources Fund, 2.83%
Barrick Gold Corp.: Gold and Precious Metals Fund, 4.25%; World Precious Minerals Fund, 0.47%
Vale SA: 0.0%
Freeport-McMoRan Copper & Gold, Inc.: Global Resources Fund, 3.27%; Gold and Precious Metals Fund, 0.14%; World Precious Minerals Fund, 0.13%
Newmont Mining Corp.: Gold and Precious Metals Fund, 2.23%; World Precious Minerals Fund, 0.43%
*The above-mentioned indices are not total returns. These returns reflect simple appreciation only and do not reflect dividend reinvestment.
The Dow Jones Industrial Average is a price-weighted average of 30 blue chip stocks that are generally leaders in their industry.
The S&P 500 Stock Index is a widely recognized capitalization-weighted index of 500 common stock prices in U.S. companies.
The Nasdaq Composite Index is a capitalization-weighted index of all Nasdaq National Market and SmallCap stocks.
The S&P BARRA Growth Index is a capitalization-weighted index of all stocks in the S&P 500 that have high price-to-book ratios.
The S&P BARRA Value Index is a capitalization-weighted index of all stocks in the S&P 500 that have low price-to-book ratios.
The Russell 2000 Index® is a U.S. equity index measuring the performance of the 2,000 smallest companies in the Russell 3000®, a widely recognized small-cap index.
The Hang Seng Composite Index is a market capitalization-weighted index that comprises the top 200 companies listed on Stock Exchange of Hong Kong, based on average market cap for the 12 months.
The Taiwan Stock Exchange Index is a capitalization-weighted index of all listed common shares traded on the Taiwan Stock Exchange.
The Korea Stock Price Index is a capitalization-weighted index of all common shares and preferred shares on the Korean Stock Exchanges.
The Philadelphia Stock Exchange Gold and Silver Index (XAU) is a capitalization-weighted index that includes the leading companies involved in the mining of gold and silver.
The U.S. Trade Weighted Dollar Index provides a general indication of the international value of the U.S. dollar.
The MSCI Russia Index is a free-float weighted equity index developed in 1994 to track major equities traded in the Russian market.
The S&P/TSX Canadian Gold Capped Sector Index is a modified capitalization-weighted index, whose equity weights are capped 25 percent and index constituents are derived from a subset stock pool of S&P/TSX Composite Index stocks.
The S&P 500 Energy Index is a capitalization-weighted index that tracks the companies in the energy sector as a subset of the S&P 500.
The S&P 500 Materials Index is a capitalization-weighted index that tracks the companies in the material sector as a subset of the S&P 500.
The S&P 500 Financials Index is a capitalization-weighted index. The index was developed with a base level of 10 for the 1941-43 base period.
The S&P 500 Industrials Index is a Materials Index is a capitalization-weighted index that tracks the companies in the industrial sector as a subset of the S&P 500.
The S&P 500 Consumer Discretionary Index is a capitalization-weighted index that tracks the companies in the consumer discretionary sector as a subset of the S&P 500.
The S&P 500 Information Technology Index is a capitalization-weighted index that tracks the companies in the information technology sector as a subset of the S&P 500.
The S&P 500 Consumer Staples Index is a Materials Index is a capitalization-weighted index that tracks the companies in the consumer staples sector as a subset of the S&P 500.
The S&P 500 Utilities Index is a capitalization-weighted index that tracks the companies in the utilities sector as a subset of the S&P 500.
The S&P 500 Healthcare Index is a capitalization-weighted index that tracks the companies in the healthcare sector as a subset of the S&P 500.
The S&P 500 Telecom Index is a Materials Index is a capitalization-weighted index that tracks the companies in the telecom sector as a subset of the S&P 500.
The Bloomberg Gold Bear/Bull Sentiment Indicator charts the percent of respondents in a weekly Bloomberg News survey of traders, investors, and analysts predicting gold prices will rise the following week. The number of participants in the survey, which is completed every Friday, may vary.
The NYSE Arca Gold Miners Index is a modified market capitalization weighted index comprised of publicly traded companies involved primarily in the mining for gold and silver.
The S&P/TSX Global Gold Index is an international benchmark tracking the world’s leading gold companies with the intent to provide an investable representative index of publicly-traded international gold companies.
The NYSE Arca Gold BUGS (Basket of Unhedged Gold Stocks) Index (HUI) is a modified equal dollar weighted index of companies involved in gold mining. The HUI Index was designed to provide significant exposure to near term movements in gold prices by including companies that do not hedge their gold production beyond 1.5 years.
The ISM manufacturing composite index is a diffusion index calculated from five of the eight sub-components of a monthly survey of purchasing managers at roughly 300 manufacturing firms from 21 industries in all 50 states.
The Purchasing Manager’s Index is an indicator of the economic health of the manufacturing sector. The PMI index is based on five major indicators: new orders, inventory levels, production, supplier deliveries and the employment environment.
The Consumer Price Index (CPI) is one of the most widely recognized price measures for tracking the price of a market basket of goods and services purchased by individuals. The weights of components are based on consumer spending patterns.

