


Will the Real Manufacturing PMI Please Stand Up?
Date Posted: December 4, 2019
Read time: 5 min
NULL
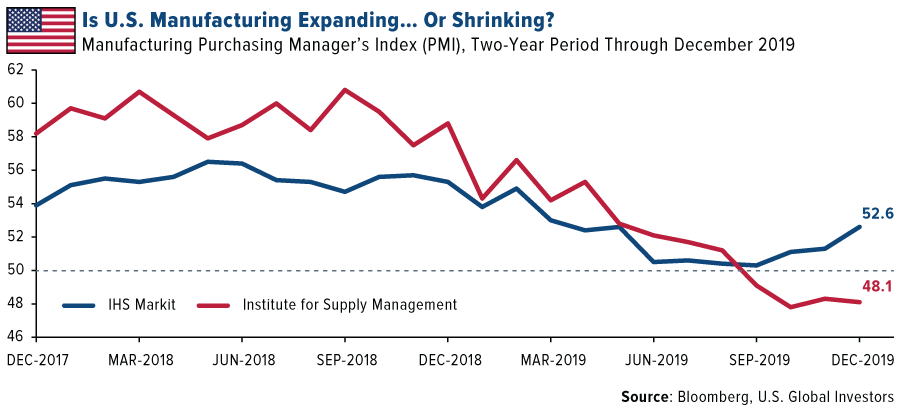
It’s the top of a new month, meaning we get to see the latest manufacturing purchasing manager’s index (PMI) readings. And if you follow both the Institute for Supply Management (ISM) and IHS Markit’s reports on U.S. factory activity, you may be getting some mixed signals.
First let’s look at the ISM report. As of November, the manufacturing PMI has now been below the key 50.0 threshold for four straight months, making this the 11th longest-running period of month-over-month contraction of the past 40 years.

The gauge registered 48.1, down from October’s 48.3 and below expectations of 49.4. This marks the fourth consecutive month of industry contraction. The current four-month period ties in length with two previous periods—one from March to June 2008, the other from December 2015 to March 2016—and is the 11th longest overall going back to 1979.
Manufacturing executives were less than optimistic in their responses. Here’s just a sampling: “Economic uncertainty continues… Slowdown in business has us revising our 2020-21 capital spend… The order book continues to shrink below our forecast levels… Profits are elusive… Tariffs are still a question.”
Although not every period of sustained ISM manufacturing contraction has been accompanied by an economic recession, each one has coincided with a stock market slowdown or pullback. During the last significant contractionary period from December 2015 to March 2016, the S&P 500 underwent three straight months of declines.
Stocks sold off Monday and Tuesday following November’s poor ISM manufacturing data, but it’s still too early to say whether a trend is developing.
A Second Opinion
Now let’s turn to IHS Markit’s report. In November, the manufacturing PMI rose up from 51.3 in October to 52.6, the third straight month of improvement and a seven-month high. Output and new orders increased to 10-month highs, while manufacturers hired at their fastest pace since March.
Chris Williamson, chief business economist at IHS Markit, commented that the PMI’s improvement “indicates that U.S. manufacturing continues to pull out of its soft patch.” He hedged this statement by pointing out that companies “remain very concerned about the disruptive effects of tariffs and trade wars in particular.”
Be that as it may, it looks as if the IHS PMI is trending up right now, unlike the ISM dataset.
Confused? How can one index show expansion while the other shows contraction in the very same industry?
The two agency’s survey methodologies are comparable, with a few notable differences. IHS gets responses from purchasing managers at as many as 800 manufacturers, focusing on five indicators: new orders, output, employment, suppliers’ delivery times and stocks of purchases. ISM, on the other hand, compiles responses from around 400 purchasing and supply executives nationwide. It also looks at 10 indicators, or twice as many as IHS: new orders, backlog of orders, new export orders, imports, production, supplier deliveries, inventories, customers’ inventories, employment and prices.
IHS’ Chris Williamson addressed this very topic in an October blog post, writing that the divergence between the two surveys could be attributable to a number of reasons, including survey panel size, differences in panel structures and the possibility that responses may relate to different markets.
The question investors may be asking themselves now is which of the two indices they should be following more closely. I don’t happen to believe that one is “better” than the other, though it’s worth reiterating that the market reacted negatively to ISM’s report.
Where to Get Safety
Depending on which agency’s index you put stock in, I believe it may be prudent for investors to consider increasing their exposure to gold, which has historically helped limit portfolio losses during times of market volatility.
In the past, investors could rely on U.S. Treasuries, which often offered attractive yields. But as of December 3, the yield on the 10-year T-note trades at 1.71 percent, which is lower than the current annual inflation rate of 1.8 percent.
What this means is that the real yield on the 10-year T-note is a big fat 0 percent.
Gold, meanwhile, is up about 13 percent for the year through December 4.
All opinions expressed and data provided are subject to change without notice. Some of these opinions may not be appropriate to every investor. By clicking the link(s) above, you will be directed to a third-party website(s). U.S. Global Investors does not endorse all information supplied by this/these website(s) and is not responsible for its/their content.
The Institute of Supply Management (ISM) Manufacturing Purchasing Managers Index (PMI) Report on Business is based on data compiled from monthly replies to questions asked of purchasing and supply executives in over 400 industrial companies. The IHS Markit US Manufacturing PMI is compiled by IHS Markit from responses to questionnaires sent to purchasing managers in a panel of around 750 manufacturers. The PMI is a weighted average of the following five indices: New Orders (30%), Output (25%), Employment (20%), Suppliers’ Delivery Times (15%) and Stocks of Purchases (10%).
The S&P 500 Stock Index is a widely recognized capitalization-weighted index of 500 common stock prices in U.S. companies.
