


Nontraditional Funds Took the Stage at World’s Biggest ETF Conference
Date Posted: February 3, 2020
Read time: 8 min
Even bigger changes could be headed our way, if some of the discussions at this year's Inside ETFs are any indication. Two topics seemed to dominate the conference: the rise of ESG investing, and the emergence of so-called "nontransparent" ETFs.

When Derek Jeter speaks, people listen. After all, the former Yankees shortstop’s talents and successes, on and off the field, seem otherworldly.
Drafted straight out of high school in 1992, Jeter went on to become the first ever Yankee to record 3,000 hits—an achievement reached by only 27 other players in baseball history. He also holds records in doubles and stolen bases.
The five-time World Series champion was recently inducted into the National Baseball Hall of Fame—in his first year of eligibility, no less—and when casting their votes, the Baseball Writers’ Association of America (BBWAA) gave Jeter the second-highest plurality in the group’s 112-year history.
Jeter stopped by at this year’s Inside ETFs in Hollywood, Florida, drawing larger crowds of attendees than any other speaker at the four-day conference. He answered questions on a wide range of topics, from the recent tragic death of NBA star Kobe Bryant—“he was such a great family man,” Jeter lamented—to his move to the front office with the Miami Marlins.
Two of his comments in particular stuck with me.
“I play to win,” he said, “and anyone who claims they do otherwise is lying.”
I’m confident everyone reading this right now feels the same level of competitiveness when investing. There’s no greater feeling than to win in the financial markets—and the reverse is also true. That brings me to the second thing:
“Every time you take the field is a new opportunity.”
One of the great certainties of life is that we all have the same 1,440 minutes in a day. If one day comes up short of your expectations, tomorrow will inevitably bring you a whole new set of opportunities. That’s the case not just in investing but also in our careers, outside interests, friendships and romances.
For now, though, let’s focus on investing—particularly ETFs.
Top Two ETF Trends to Watch: ESG and Nontransparent
U.S.-based ETFs had a red-hot 2019, ending the year with $4.4 trillion in assets, a 30 percent increase from 2018.
Even bigger changes could be headed our way, if some of the discussions at this year’s Inside ETFs are any indication. Two topics seemed to dominate the conference: the rise of ESG investing, and the emergence of so-called “nontransparent” ETFs.
I’ve talked before about ESG—or “environmental, social and corporate governance.” Such ETFs strategically limit their exposure to companies that produce lots of carbon, for example, while boosting those that may have greater diversity on their boards and in the C-suite.
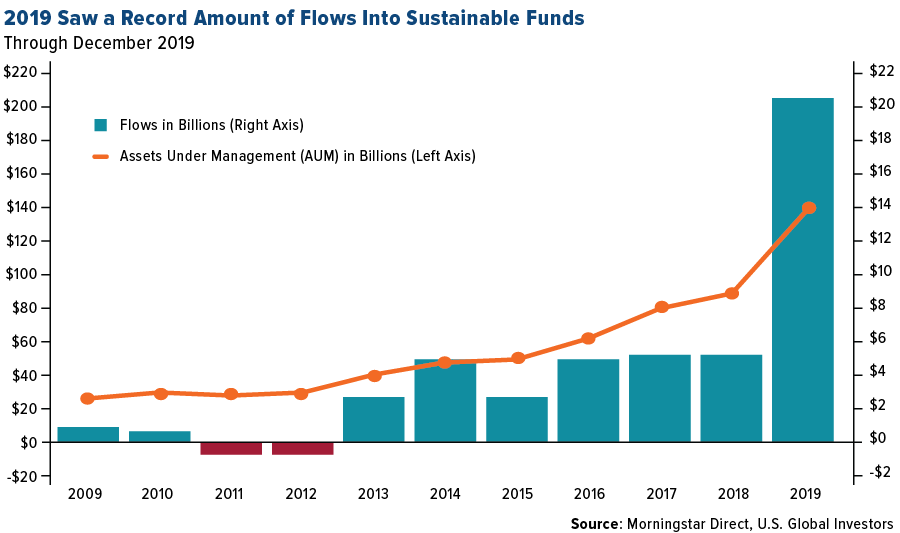
For many years now, ESG has been a niche focus, seeing muted flows by only the most “green”-minded investors. A tipping point seems to have occurred in 2019, though, with net flows into open-end and exchange-traded ESG funds topping $20.6 billion, according to Morningstar data. That’s four times the amount that such funds attracted the previous year. ESG appears to have gone mainstream.
And yet this may only be the beginning. A January survey conducted by the deVere Group found that a whopping eight out of 10 millennial investors around the globe cited ESG as a top priority when considering investment opportunities, trumping even anticipated returns and past performance. Millennials are now the largest living generation, having surpassed baby boomers, so this change in investor appetite is expected to transform world markets.
As for nontransparent ETFs, these are a new-ish breed of funds that take the best from both mutual funds and ETFs and combine them into one 40 Act investment vehicle. Also called “semitransparent” ETFs or “exchange-traded managed funds (ETMFs),” these lower-cost products can be traded throughout the day on an exchange like typical ETFs. They also have all of their tax efficiency. Where they differ from ETFs, however, is they don’t have to disclose all of their positions and weightings on a daily basis—hence, “nontransparent.” Such a structure will allow active managers to tap into the popular ETF market without having to give away their intellectual property (IP).
Like ESG strategies, nontransparent funds are among the fastest growing segments of the ETF industry. Expect to read more about them in the coming weeks and months.
Bullish on Domestic Equities? Proceed With Caution
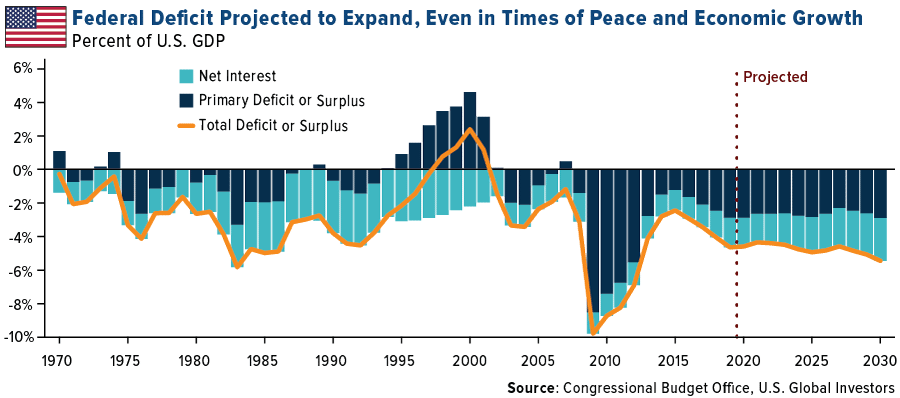
Also top of mind among several presenters was the longevity of the U.S. stock bull market. One of the biggest long-term risks continues to be runaway federal spending. The Congressional Budget Office (CBO) last week released its projection that the federal deficit—or the difference between tax revenues and spending—will exceed $1 trillion in 2020 and all subsequent years if nothing changes. That’s unprecedented in times of peace and economic growth. It also threatens to curb additional expansion, as debt service will increasingly grow as a percent of federal expenditures, siphoning away funds that could instead be spent on infrastructure, defense and more.
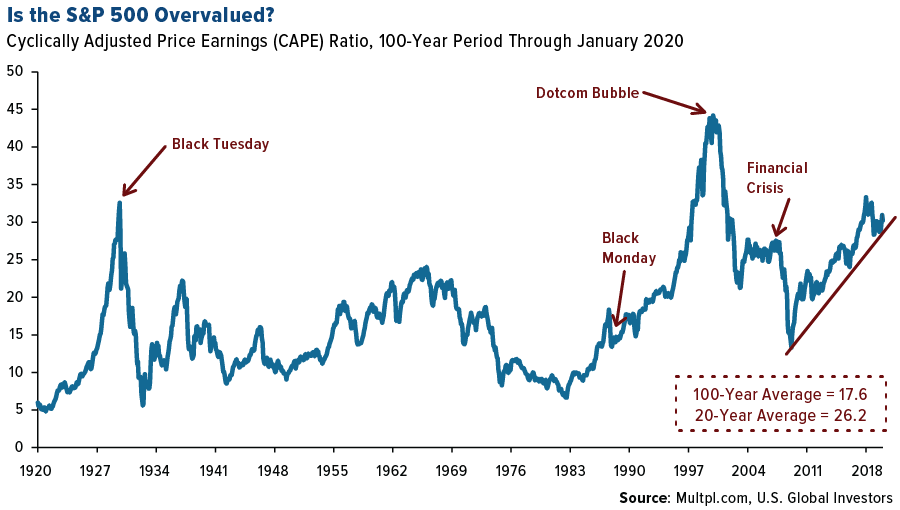
As was pointed out numerous times during the conference, the S&P 500 Index is looking highly overvalued right now, with a cyclically adjusted price-to-earnings (CAPE) ratio of above 31 times earnings in January. That’s well above the 100-year average of 17.6 times earnings and 20-year average of 26.2 times earnings. It also puts valuations in a similarly elevated range as when stocks collapsed in 1929 and during the dotcom bubble of 1999-2000.
So what can investors do? In short, make sure you’re diversified, particularly in emerging markets (EM), Treasury bills and hard assets such as gold, precious metals and real estate.
That was the advice of Larry Swedroe, chief research officer of Buckingham Strategic Wealth and author of Your Complete Guide to a Successful and Secure Retirement,released just last year.
Granted, staying diversified is sometimes easier said than done, especially when the stock market has regularly been hitting new all-time highs—that is, before coronavirus fears began rattling investors. To illustrate his point, Swedroe shared with us a quote by portfolio manager James Gipson that I think many of you will find a lot of humor (and truth!) in:
“Diversification for investors, like celibacy for teenagers, is a concept both easy to understand and hard to practice.”
Negative-Yielding Debt Rises to $13 Trillion
Speaking of gold, the yellow metal ended last week up on market volatility and has now increased more than 4 percent so far in the new year. The pool of global government bonds trading with a negative yield rose $1.16 trillion recently to top approximately $13 trillion. That’s still below the record amount of $17 trillion, last seen in August of last year, but it’s just one of several risk factors investors should keep their eyes on.
Is now the time to invest in precious metals? Watch my recent interview from the sidelines of the Vancouver Resource Investment Conference (VRIC) by clicking here!
All opinions expressed and data provided are subject to change without notice. Some of these opinions may not be appropriate to every investor. By clicking the link(s) above, you will be directed to a third-party website(s). U.S. Global Investors does not endorse all information supplied by this/these website(s) and is not responsible for its/their content.
The S&P 500 Stock Index is a widely recognized capitalization-weighted index of 500 common stock prices in U.S. companies.
The cyclically adjusted price-to-earnings ratio, commonly known as CAPE, Shiller P/E, or P/E 10 ratio, is a valuation measure usually applied to the US S&P 500 equity market. It is defined as price divided by the average of ten years of earnings, adjusted for inflation.
