


Gold Sparkles as “The Great Lockdown” Hammers the Global Economy
Date Posted: April 14, 2020
Read time: 8 min
Gold and gold stocks are among the highest performing assets of 2020 so far as investors seek a haven amid the coronavirus-fueled rout, and as central banks and governments around the world roll out unprecedented monetary and fiscal measures in an effort to mitigate the economic impact of the "Great Lockdown."
Gold and gold stocks are among the highest performing assets of 2020 so far as investors seek a haven amid the coronavirus-fueled rout, and as central banks and governments around the world roll out unprecedented monetary and fiscal measures in an effort to mitigate the economic impact of the “Great Lockdown.”
That’s the name the International Monetary Fund (IMF) has given this uncertain period, and I believe it may stick. The IMF added that the “world economy will experience the worst recession since the Great Depression,” with global economic growth this year projected to fall to negative 3 percent.
This highlights the importance of protecting your family’s wealth right now, which savvy investors have historically managed to do with gold and precious metals.
Physical gold was up about 13.8 percent through April 10, while senior gold miners advanced 2.8 percent, making the group the best asset class of the year so far. Longtime readers of Frank Talk know that I frequently recommend a 10 percent weighting in gold and gold stocks, and now you can see why. A 10 percent allocation at the beginning of the year—before any of us had ever heard of the novel coronavirus—could have helped minimize the impact of losses in other positions.
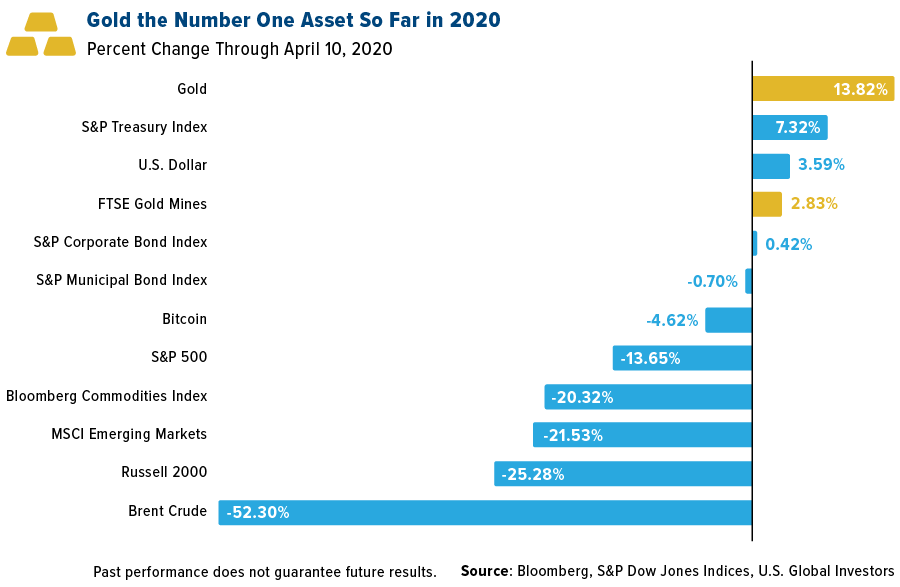
The problem is that too few investors have adequate exposure to the yellow metal. That’s the case even for many who may believe they do. As the World Gold Council (WGC) pointed out last year, most broad-based commodity indices have a very small weighting in gold—the S&P GSCI’s, for instance, is only 3.37 percent. What this means is that investors in funds that track these indices likely do not get the full benefit of having gold in their portfolio.
That’s why I recommend that the 10 percent weighting be split into two halves, with 5 percent in physical gold (bars, coins, 12-karat jewelry) and the other 5 percent in high-quality gold and precious metal mining stocks, mutual funds and ETFs.
Maybe you’ve missed the rally up to this point, but the good news is that it’s probably still not too late to participate.
Gold Well-Positioned to Revert to Its Mean Relative to the S&P 500
According to analysis by Bloomberg commodity strategist Mike McGlone, the price of gold appears to be seeking to revert to its long-term mean relative to the S&P 500 Index. This would suggest that we could see a new record high, driven largely by excessive money printing.
“Unprecedented global monetary stimulus is a worthy catalyst for the per-ounce price of gold to revert to its long-term mean vs. the S&P 500 Index, in our view,” McGlone explains.
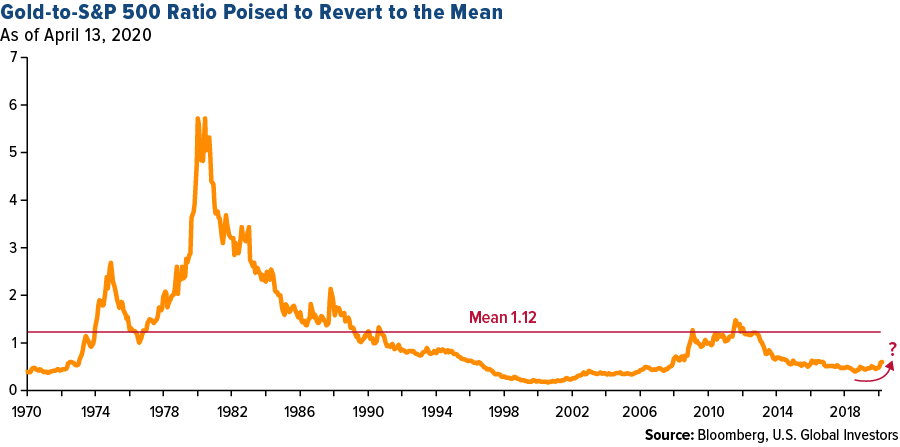
The implication of mean reversion right now is that gold would hit a new all-time high, assuming the S&P continues to trade around 2,800. After all, a one-to-one ratio means that both assets are trading at the same level.
This has happened before, as you can see in the chart above. As recently as March 2013, both spot gold and the S&P 500 were trading in the same 1,500 to 1,600 range. Before that, in May 1990, it was a 330 to 360 range.
A reversion to the mean now—again, assuming the S&P continues to trade at its current level—would put the yellow metal at approximately $2,800 an ounce, a new record high by far.
But remember, that’s just a simple one-to-one ratio. The long-term gold/S&P mean is slightly higher, at 1.12, so the gold price would also be slightly higher, possibly closer to $3,000 an ounce.
Mean reversion is something I write about more in-depth in “Managing Expectations: Anticipate Before You Participate in the Market,” which you can read by clicking here.
Interest in Gold Mining Stocks and Gold Royalty Companies Takes Off
Not enough investors have optimal exposure to gold, according to the WGC, but we’re currently seeing a surge in interest in gold mining stocks and gold royalty companies, if Google search data is any indication.
Search terms using “gold mining stocks” and “gold royalty companies” were higher this month than at any other time in the past 10 years. That includes when the yellow metal hit its record high of $1,900 an ounce in 2011.

Google Trends isn’t a leading indicator recognized by mainstream economists and market analysts, but I believe it shows where investors’ thinking may be at right now. They’re seeking a way to preserve their wealth as we face what could be the worst economic downturn in nearly 100 years, and they’re betting that higher precious metal prices will send shares of gold mining and royalty companies higher as well.
It’s not a bad strategy.
All opinions expressed and data provided are subject to change without notice. Some of these opinions may not be appropriate to every investor. By clicking the link(s) above, you will be directed to a third-party website(s). U.S. Global Investors does not endorse all information supplied by this/these website(s) and is not responsible for its/their content.
The S&P U.S. Treasury Bond Index is a broad, comprehensive, market-value weighted index that seeks to measure the performance of the U.S. Treasury Bond market. The U.S. Dollar Index is an index of the value of the United States dollar relative to a basket of foreign currencies, often referred to as a basket of U.S. trade partners’ currencies. The FTSE Gold Mines Index encompasses all gold mining companies that have a sustainable and attributable gold production of at least 300,000 ounces a year, and that derive 75% or more of their revenue from mined gold. The S&P 500 Investment Grade Corporate Bond Index, a sub-index of the S&P 500 Bond Index, seeks to measure the performance of U.S. corporate debt issued by constituents in the S&P 500 with an investment-grade rating. The S&P Municipal Bond Index is a broad, market value-weighted index that seeks to measure the performance of the U.S. municipal bond market. The S&P 500 Stock Index is a widely recognized capitalization-weighted index of 500 common stock prices in U.S. companies. The Bloomberg Commodity Index is made up of 22 exchange-traded futures on physical commodities. The index represents 20 commodities, which are weighted to account for economic significance and market liquidity. The MSCI Emerging Markets Index is a free float-adjusted market capitalization index that is designed to measure equity market performance in the global emerging markets. The Russell 2000 Index is a U.S. equity index measuring the performance of the 2,000 smallest companies in the Russell 3000. The Russell 3000 Index consists of the 3,000 largest U.S. companies as determined by total market capitalization. The S&P GSCI Total Return Index in USD is widely recognized as the leading measure of general commodity price movements and inflation in the world economy. Index is calculated primarily on a world production weighted basis, comprised of the principal physical commodities futures contracts.
