


With Yields Sinking Everywhere, Gold Just Hit New All-Time Highs…
Date Posted: August 12, 2019
Read time: 9 min
"It is no longer absurd to think that the nominal yield on U.S. Treasury securities could go negative," Joachim Fels, PIMCO's global economic advisor, warned investors last week. "Whenever the world economy next goes into hibernation, U.S. Treasuries--which many investors view as the ultimate 'safe haven' apart from gold--may be no exception to the negative yield phenomenon."
“It is no longer absurd to think that the nominal yield on U.S. Treasury securities could go negative,” Joachim Fels, PIMCO’s global economic advisor, warned investors last week. “Whenever the world economy next goes into hibernation, U.S. Treasuries—which many investors view as the ultimate ‘safe haven’ apart from gold—may be no exception to the negative yield phenomenon.”
Fels seems not to be the only investor with this idea, judging by the increased demand for gold.
The price of the yellow metal had its best week in nearly two months as the total value of negative-yielding debt around the world touched a new record of $15 trillion. With the nominal yield on the 10-year Treasury having fallen below 2 percent—and just shy of 0 percent on an inflation-adjusted basis—gold surged above $1,500 an ounce in U.S. dollars (USD) for the first time since September 2013.
It also hit historic all-time highs when priced in a number of other world currencies, including the British pound, Russian ruble and Indian rupee. Last week, the central bank of India, along with those in New Zealand and Thailand, surprised markets by cutting rates more than expected, adding to fears that an economic slowdown is imminent.
On Wednesday, gold’s performance for 2019 caught up with and surpassed that of the stock market.

Analysts at Goldman Sachs now say that $1,500 is only the beginning, and that we could see $1,600-an-ounce gold within the next six months.
“If growth worries persist, possibly due to a trade war escalation, gold could go even higher, driven by a larger ETF gold allocation from portfolio managers who still continue to under-own gold,” Goldman analyst Sabine Schels said in a note to investors last week. “Gold ETFs have recently built momentum almost as strong as in 2016, and we believe that can be maintained in the short-term.”
Indeed, gold ETFs attracted $2.6 billion of net global inflows in July alone, raising their collective holdings to 2,600 tonnes—a level unseen since March 2013, according to the World Gold Council (WGC).
A $1.2 Trillion Hit to the World Economy
For further insight on global trade, Goldman no longer believes a resolution to the U.S.-China trade war will occur before the 2020 presidential election. On Friday, in fact, President Donald Trump told reporters that “we are not ready to make a deal” with China, “but we’ll see what happens.”
Should the trade war continue to escalate, it could cost the world economy “dearly,” according to Bloomberg. New modeling by Bloomberg analysts shows that global GDP would be 0.6 percent lower by 2021, amounting to a whopping $1.2 trillion hit, if markets slumped as a result of a full blown trade war.
Currency Wars Are Pushing Up the Price of Gold
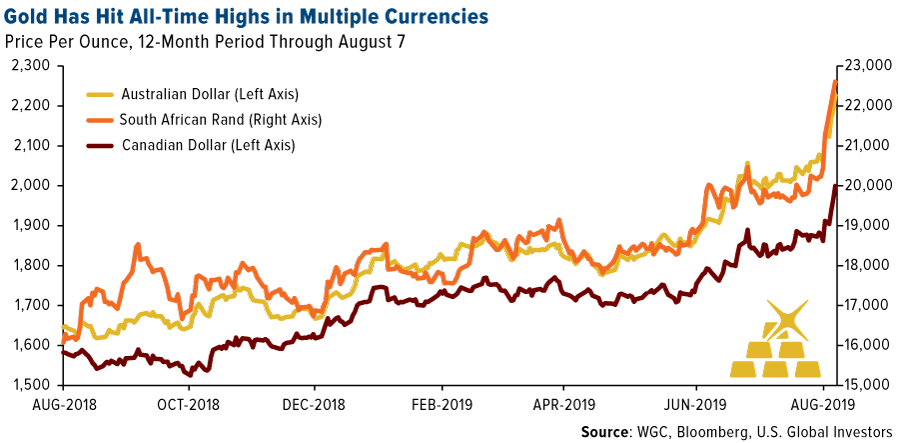
Again, it’s not just USD-priced gold that’s done well in recent days. The precious metal blew past new all-time highs in a number of currencies on top of those I already mentioned. They also included currencies in major gold-producing economies such as Australia, Canada and South Africa. Australia’s dollar traded at its lowest level against the USD since the financial crisis a decade ago.
One of our favorite ways to play this appreciation is with Russia gold stocks, particularly Moscow-based Polyus, which was up nearly 55 percent in the 12 months through August 8. Its peers, Polymetal (up 51 percent) and Highland Gold (75 percent), have also been winners in a strong gold-price environment.
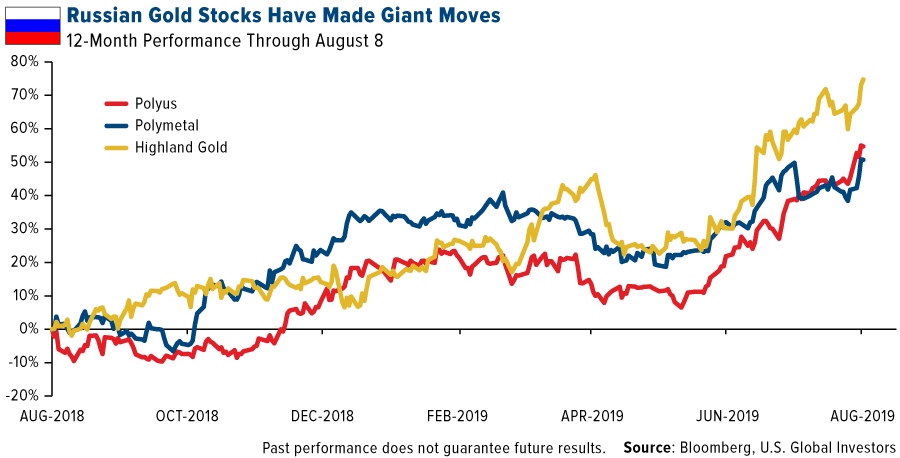
“Polyus is undoubtedly a growth company,” according to equity research firm Wood & Company. Analysts there note Polyus’ lower-than-average production cost of only $348 an ounce last year and attractive valuation of 6.8 times price-to-earnings (P/E). “It offers a decent yield more long-term growth than any other stock in Russian metals and mining, and we believe the sanction risks are small,” Wood analysts write. The producer’s dividend yield is expected to average between 5 percent and 6 percent this year, well above its peers.
Beijing Wants Even More Gold in Its Reserves
In other currency war news, China added to its official gold holdings for the eighth straight month in July. Its central bank increased holdings as much as 10 tons, after raising it 84 tons in June. Total holdings now stand at 62.26 million ounces, as the world’s second largest economy expands its efforts to diversify away from the USD.
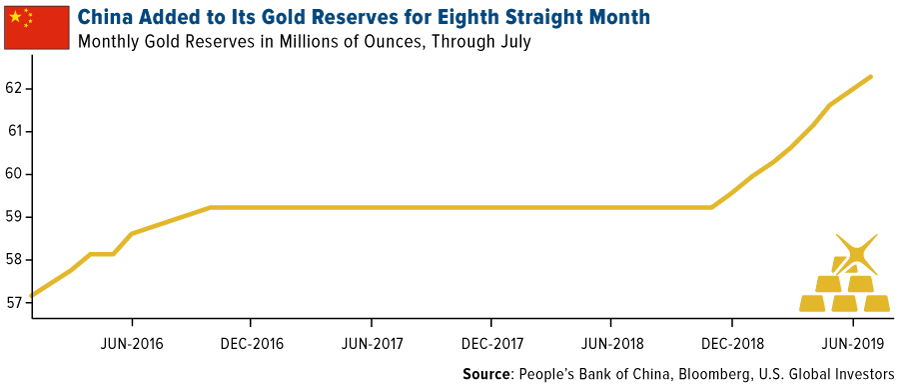
As I explained earlier last week, China allowed its currency, the renminbi, to weaken past 7.0 versus the USD, a level not seen since 2008. This was just the latest development in the country’s trade spat with the U.S. that’s nearing its 18th month.
Doctor Copper Hits a Two-Year Low on Growth Concerns
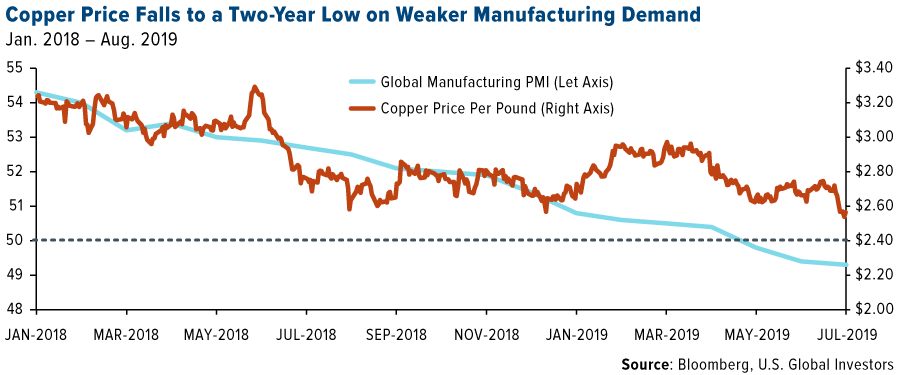
Fears of slower growth may be beneficial for the price of gold right now, but they’re taking a toll on copper, often seen as a barometer for the global economy. The red metal is widely used in, well, anything that needs to conduct an electrical charge, and when a slowdown in industrial demand is expected, prices struggle.
Take a look below. Copper has more or less followed the global manufacturing purchasing manager’s index (PMI) down over the past year and a half. Factories across the globe contracted for the third straight month in July.
As the Wall Street Journal puts it, the slide “threatens to limit investment in new mines, a trend that industry analysts and executives say could lead in coming years to sizable shortages of the material critical to manufacturing and renewable-energy projects.”
The price of copper slid as low as $2.53 per pound on last Monday, a 52-week low and nearly 25 percent down from its recent high of $3.30 from last June.
An economic gauge of heavy copper-using manufacturers indicated contraction in July. The Global Copper Users PMI fell from 50.0 in June to 48.6 last month, the weakest result in five months, according to IHS Markit.
“Companies noted that raised trade tensions played a part in reducing production, as new export orders fell at a sharper rate,” said IHS Markit economist David Owen, who added that weakness in the European auto sector also played a role in declining copper demand.
Want to learn more about the recent moves in metals and oil? Listen to my interview with Bloomberg’s Lisa Abramowicz and Paul Sweeney by clicking here!
All opinions expressed and data provided are subject to change without notice. Some of these opinions may not be appropriate to every investor.
The dividend yield or dividend-price ratio of a share is the dividend per share, divided by the price per share. It is also a company’s total annual dividend payments divided by its market capitalization, assuming the number of shares is constant. It is often expressed as a percentage. There is no guarantee that the issuers of any securities will declare dividends in the future or that, if declared, will remain at current levels or increase over time.
The S&P 500 measures the value of the stocks of the500 largest corporations by market capitalization listed on the New York Stock Exchange or Nasdaq Composite.
The Purchasing Managers’ Index (PMI) is an index of the prevailing direction of economic trends in the manufacturing and service sectors. It consists of a diffusion index that summarizes whether market conditions, as viewed by purchasing managers, are expanding, staying the same, or contracting. The purpose of the PMI is to provide information about current and future business conditions to company decision makers, analysts, and investors. The Global Copper Users Purchasing Managers Index (PMI) is a composite indicator designed to give an accurate overview of operating conditions at manufacturers identified as heavy users of copper.
The price-to-earnings ratio (P/E ratio) is the ratio for valuing a company that measures its current share price relative to its per-share earnings (EPS).
Holdings may change daily. Holdings are reported as of the most recent quarter-end. The following securities mentioned in the article were held by one or more accounts managed by U.S. Global Investors as of (06/30/2019): Polymetal International PLC, Polyus PJSC, Highland Gold Mining Ltd.
