


America Remains the Land of Opportunity. For Everything Else, There’s Gold
Date Posted: January 3, 2020
Read time: 58 min
In 1967, a woman then known as Svetlana Alliuyeva arrived by plane in New York. Moments after landing, she held a press conference during which she renounced her native Soviet Russia, describing it as "profoundly corrupt." She burned her Soviet passport and called her father--who had died in Russia a decade earlier--"a moral and spiritual monster."
Press Release: U.S. Global Investors Announces Pending Sale of Galileo Global Equity Advisors Inc.
By Frank Holmes
CEO and Chief Investment Officer
U.S. Global Investors

In 1967, a woman then known as Svetlana Alliuyeva arrived by plane in New York. Moments after landing, she held a press conference during which she renounced her native Soviet Russia, describing it as “profoundly corrupt.” She burned her Soviet passport and called her father—who had died in Russia a decade earlier—“a moral and spiritual monster.”
Her father was Joseph Stalin, the former dictator of the USSR.
In case you weren’t around at the time, Svetlana’s defection to the U.S. was a very huge deal. Having changed her name after remarrying, Lana Peters became a U.S. citizen in 1978. She made millions from her autobiography—something that was categorically unachievable in her communist homeland.
In 1991, she got to see the fall of the government her father once had ultimate authority over. Almost exactly 20 years later, Lana Peters passed away in Wisconsin.
Although Lana’s story is a lot more complicated than I make it out to be, I think it’s one that many Americans should remind themselves of and take to heart. She fled her father’s communist regime to seek a better life, and she found it in the U.S.
Communism and Socialism Gaining Favor Among Millennial Americans
I share this with you now because here we are nearly 30 years out from the collapse of the USSR, and the lessons of the past appear not to be resonating with some young Americans.
Need proof? For four years now, the Victims of Communism Memorial Foundation—a Washington, D.C.- based nonprofit—has been polling Americans on their attitudes toward communism and socialism. What the group found in its most recent poll is that, between 2018 and 2019, millennials’ favorability of communism increased a whopping 36 percent.
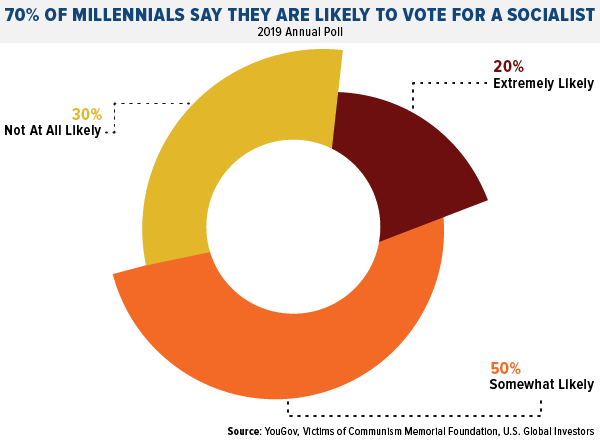
What’s more, almost three quarters of millennials—those aged 23 to 38—said they were “likely” to vote for a socialist-minded politician in upcoming elections. Half of those surveyed said they were “somewhat likely,” while as much as 20 percent said they were “extremely likely” to support a socialist candidate in the mold of Vermont senator Bernie Sanders or New York congresswoman Alexandria Ocasio-Cortez (AOC).
We should all be alarmed about this.
It means, number one, that young Americans don’t feel as if capitalism is working in their favor. And number two, it means we’re not doing enough as a society to educate our citizens of the slippery slope that is collectivist thinking, which includes communism and socialism.
Absolute Power Corrupts Absolutely
In addition, there are some who try to explain away the USSR’s failure (or Cuba’s or Venezuela’s) by laying the blame not at the altar of communism, where it belongs, but at the feet of corrupt leaders such as Stalin, Fidel Castro, Nicolas Maduro and others. “It’s not ‘real’ socialism,” some like to say when confronted with the ugly reality of Venezuela’s failed economy.
But such thinking is a fallacy, says famed psychologist and political commentator Jordan Peterson.
“It’s the most arrogant possible statement anyone could ever make,” he commented during a 2017 lecture. People who believe they have higher moral standards than Stalin, and who think they would have done a better job than him in his position, simply “don’t understand” how the system operates, according to Dr. Peterson.
And even if they did know the system backwards and forwards, “there would have been someone else right behind you waiting to shoot you the first time you actually tried to do anything good”—which is precisely what Stalin did.
“So even if you do happen to be that avatar of moral purity that you claim implicitly,” Dr. Peterson said, “the probability that you could get to act out your goodness in relationship to those possessed by your ideology is zero.”
Gold Had Its Best Year Since 2010
I’m optimistic that the U.S. will stand as a beacon of freedom and opportunity in the 2020s and beyond, but with more and more younger Americans supporting socialism over capitalism, I believe it prudent to proceed with caution. That means making sure you’re following the 10 Percent Golden Rule, which states that you should have 10 percent of your portfolio in gold—split between physical gold such as coins and jewelry, and gold mining stocks and ETFs.
I’ve always believed that if you love your family, and if you seek to protect their wealth against potentially disastrous government policies, it’s wise to hold gold.
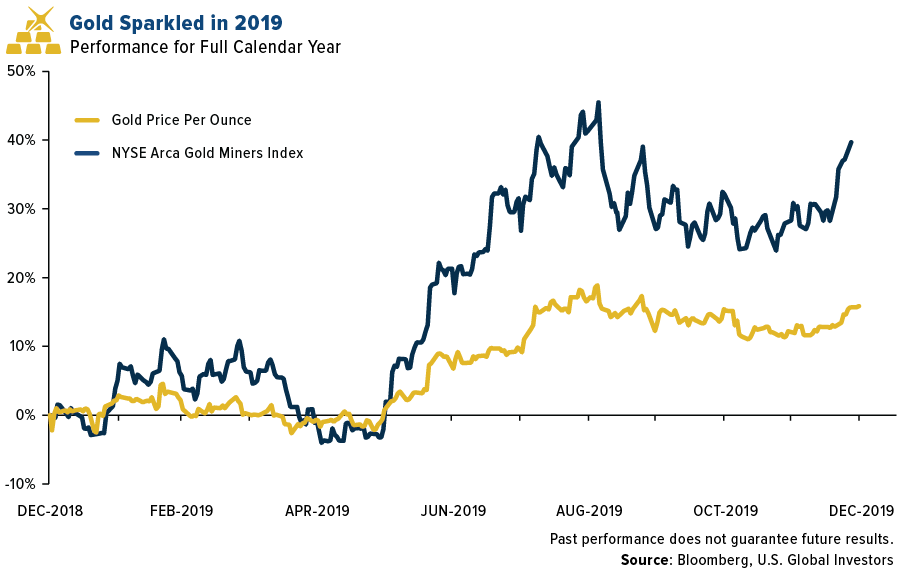
The yellow metal had an excellent year, closing out 2019 on solid footing for 2020. While the per-ounce price of gold bullion increased more than 15 percent—its best year since 2010—gold mining stocks returned an impressive 40 percent for the year. That was enough to beat the S&P 500, which was up about 29 percent in 2019.
A new decade has begun, meaning now might be a good time to rebalance your portfolio. I recommend the 10 Percent Golden Rule, which you can learn more about by clicking here!

Gold Market
This week spot gold closed at $1,552.20, up $41.64 per ounce, or 2.76 percent. Gold stocks, as measured by the NYSE Arca Gold Miners Index, ended the week higher by 1.11 percent. The S&P/TSX Venture Index came in up 4.23 percent. The U.S. Trade-Weighted Dollar fell just 0.02 percent this week.
| Date | Event | Survey | Actual | Prior |
|---|---|---|---|---|
| Dec-30 | Hong Kong Exports | -6.2% | -1.4% | -9.2% |
| Dec-31 | Conf. Board Consumer Confidence | 128.5 | 126.5 | 126.8 |
| Jan-1 | Caixin China PMI Mfg | 51.6 | 51.5 | 51.8 |
| Jan-2 | Initial Jobless Claims | 220k | 222k | 224k |
| Jan-3 | Germany CPI YoY | 1.4.% | 1.5% | 1.1% |
| Jan-3 | ISM Manufacturing | 49.0 | 47.2 | 48.1 |
| Jan-7 | Eurozone CPI Core YoY | 1.3% | — | 1.3% |
| Jan-7 | Durable Goods Orders | — | — | -2.0% |
| Jan-8 | ADP Employment Change | 160k | — | 67k |
| Jan-9 | Initial Jobless Claims | 221k | — | 222k |
| Jan-10 | Change in Nonfarm Payrolls | 158k | — | 266k |
Strengths
- The top performing precious metal for 2019 was palladium, gaining 54.20 percent. In a weekly Bloomberg survey of analysts and traders, gold sentiment remained marginally bullish the first days of the New Year. The survey showed eight bullish, two bearish and seven neutral. At week-end, gold advanced toward a six-year high, climbing 1.5 percent to $1,551 an ounce in London, after a U.S. airstrike killed one of Iran’s most powerful generals, reports Bloomberg.
- Gold had a strong finish to the year, recording its biggest annual advance since 2010 as the dollar weakened, reports Bloomberg, even amid optimism on the trade front along with signs of stabilization in China’s economy. In a statement from the London Bullion Market Association, the amount of gold held in London vaults rose 2.5 percent from a month earlier to 8,228 tons in September. That’s the highest in data going back to July 2016. In related news, Hong Kong’s purchases of gold coins from China surged last month as demand for haven assets soared amid the ongoing social unrest.
- Weekly CFTC data on futures and options show that money managers have increased their bullish platinum bets by 2,655 net-long positions to 41,825, reports Bloomberg. Platinum futures also climbed as much as 1.7 percent to $1,001.40 an ounce in New York. This reached the highest for a most-active contract since February 2018.
Weaknesses
- The worst performing precious metal for 2019 was silver, gaining only 15.21 percent. Gold holdings in Turkey’s central bank continue to fall, reports Bloomberg. The holdings are now worth $25.1 billion, as of December 27, weekly figures report.
- Despite bullion’s rally, it isn’t doing much to aid in the sales of coins made from the shiny metal, reports Bloomberg. Purchases of American Eagle gold coins shrank to 2,000 ounces last month, the lowest since December 2015, according to data from the U.S. Mint.
- A statement by water commission Conagua reports that Newmont Goldcorp’s Penasquito mine, along with the Mexican government, have reached an agreement to protect the Cedros aquifer in the state of Zacatecas. Penasquito had around 80 percent of the aquifer’s volume concessioned, part of which it gave up as part of the agreement.
Opportunities
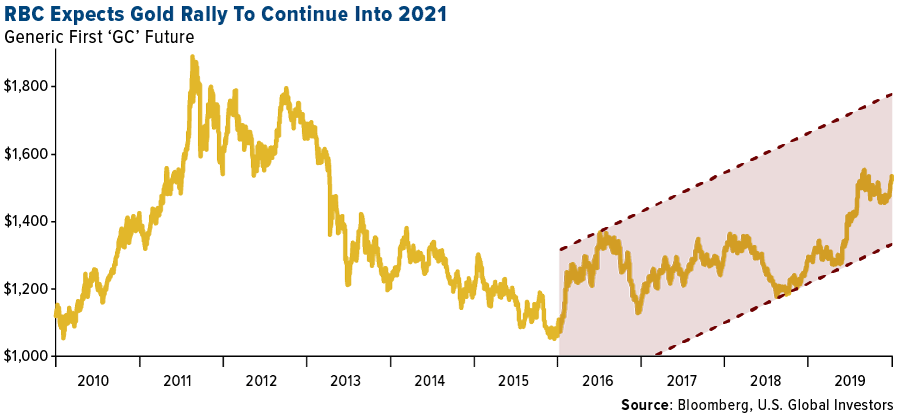
- RBC Capital Markets thinks that the price of gold could tack on another 11 percent to its 19 percent gains over the last year, reports Bloomberg. The bank’s strategists led by Christopher Louney wrote in a note that although gold prices have historically been volatile and could see some fluctuations over the next two years on a quarterly basis, the yearly story could paint a different picture. On a yearly basis, the trajectory is likely higher. And with gold’s rally potentially continuing, silver can also rally further, reports Bloomberg. The two metals are highly correlated, and with a comparative beta 1.3, silver offers greater potential upside.
- Tyler Durden of Zero Hedge provided an analysis this week shedding some light on how the Fed is already conducting “Helicopter Money.” His article notes that the Fed’s charter prohibits it from directly purchasing bonds or bills issued by the U.S. Treasury, but what’s to stop the Fed from purchasing such U.S. debt just after the issuing trade settles? Apparently, that is okay. With some sleuthing, Durden dug through the government filings and traced debt issuance on December 16th, 19th, and 20th where T-Bills were sold to the broker/dealer and as soon as the trade settled, the Fed bought the debt back from the broker /dealer circumventing the hurdle that prohibits direct purchases. Obviously, the broker/dealers aren’t likely doing this for free.
- Several companies have released news of strategic investments heading into the New Year. Manitou Gold Inc., for example, announced the closing of a $3 million financing and strategic investment by Alamos Gold Inc. and 03 Mining, reads one press release. On Tuesday, similarly, Red Pine Exploration said it closed a brokered C$3.78 million private placement of flow-through and common share units that included an investment in the company by Alamos Gold – which took a 19.9 percent stake in the company. Clearly, the established gold mining companies are actively buying stakes in exploration and development companies. Other company news includes drilling numbers from Scottie Resources Corp. of 73.32 g/t gold and 71.01 g/t silver over 4.38 meters, which announced that drilling continues to confirm and expand the Bend Vein target on its Bow Property. Lastly, Bob Moriarty from 321Gold highlighted recently TriStar Gold and its Witwatersrand lookalike deposit in Brazil – check it out in Streetwise Reports.
Threats
- S&P Global Ratings was the most bearish on U.S. corporate debt in 2019 than at any other point in the last decade, reports Bloomberg. In fact, 2019 saw the most credit rating downgrades for U.S. companies relative to upgrades since 2009, according to S&P data. Energy names bore the brunt of the downgrades.
- Thomas Barkin, President of the Federal Reserve Bank of Richmond, says a potential escalation of U.S. tensions with Iran is among the shocks that could threaten America’s record-long economic expansion, reports Bloomberg, which he says for now looks “quite healthy.” “There’s always the possibility of a heart attack or a shock, perhaps caused by global risks,” Barkin explained in a speech on Friday in Baltimore. “Imagine an escalation with Iran or a collapse in international economies.” Such events raise the possibility that the Fed might actually cut rates in the coming year.
- DB Macro, in a research note, outlines six things on Iran for the week that investors should be aware of following the big geopolitical event overnight. While all six points are of important context, the first really stands out to us. Coming from Oliver Harvey, U.K. Macro Strategist: he notes this is by far the most worrying escalation of a simmering conflict between the U.S. and Iran since the U.S.’s withdrawal from the JCPA in May 2018. He says it is almost analogous to Iran assassinating Vice President Pence in terms of importance of Soleimani.

Index Summary
- The major market indices finished mixed this week. The Dow Jones Industrial Average lost 0.04 percent. The S&P 500 Stock Index fell 0.16 percent, while the Nasdaq Composite climbed 0.16 percent. The Russell 2000 small capitalization index lost 0.49 percent this week.
- The Hang Seng Composite gained 0.80 percent this week; while Taiwan was up 0.16 percent and the KOSPI fell 1.26 percent.
- The 10-year Treasury bond yield fell 8 basis points to 1.79 percent.
Domestic Equity Market
Strengths
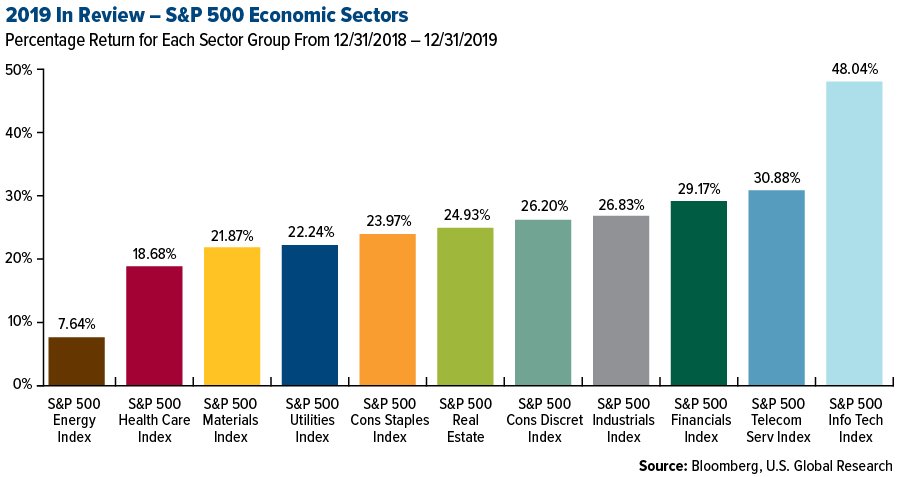
- Information technology was the best performing sector of the year, increasing by 48.04 percent versus an overall increase of 28.88 percent for the S&P 500.
- Advanced Micro Devices was the best performing S&P 500 stock for the year, increasing 148.43 percent.
- Wall Street closed out the year on Tuesday with the broader market delivering its best returns in six years, reports AP News. The S&P 500 finished up 28.9 percent and the Nasdaq Composite rose 35.3 percent for the year. For both indices it was the best annual performance since 2013. The Dow Jones Industrial Average gained 22.3 percent, led by Apple.
Weaknesses
- Energy was the worst performing sector for the year, increasing by 7.64 percent versus an overall increase of 28.88 percent for the S&P 500.
- Abiomed, a medical device company, was the worst performing S&P 500 stock for the year, falling 47.52 percent.
- Core Laboratories NV closed out the year on a sour note, down more than 18 percent on Tuesday. It was its largest daily percent drop since July 2000, a result of the company announcing it now expects a fourth-quarter profit of 37-38 cents per share, down from a prior forecast of 44-45 cents.
Opportunities
- Technology stocks tumbled on Friday, participating in a broad equity-market decline that was sparked by escalating geopolitical tensions, but the sell-off represents a buying opportunity, according to Wedbush. Tech stocks were among the laggards of the market. Despite this “gut punch” to equities, “the set up for 2020 is set to be a robust one for tech stocks,” wrote Wedbush analyst Daniel Ives.
- U.S. energy stocks gained along with oil prices pre-market Friday after U.S. forces killed a top Iranian general in Iraq, raising concerns that conflict in the oil-rich region may escalate.
- European banking stocks, the past decade’s worst-performing sector, are off to their best start to the year since 2013. The Stoxx Europe 600 Banks Index jumped on Thursday, pushing its valuation to the highest since September 2018, as investors turned to riskier assets on news that China’s central bank will increase the supply of cheap funding to banks, supporting the economy.
Threats
- As global stocks sold off Friday amid escalating tensions between the U.S. and Iran, some market observers were quick to draw a parallel between now and the Persian Gulf War three decades ago. Back then, equities had also just finished a banner year with the S&P 500 jumping 27 percent in 1989. Stocks peaked in July the following year, one month before the Gulf War began with a massive U.S.-led air offensive against Iraq. Over a stretch of three months, the benchmark tumbled as much as 20 percent.
- Downgrades in recent weeks have pushed analysts’ outlook on Wells Fargo & Co. to its bleakest since the financial crisis. Seven of the 31 analysts tracked by Bloomberg now have a sell rating or its equivalent on the firm, which is still reeling from scandals that erupted more than three years ago. That’s the highest proportion of sell ratings on Wells Fargo in more than a decade, and the bank hasn’t had so few buy ratings in at least 15 years.
- Airlines are looking weaker and could be impacted further as fuel prices soar amid the Middle East unrest.
The Economy and Bond Market
Strengths
- Real U.S. GDP, which is inflation-adjusted GDP and is typically used for measuring growth, grew between 2 and 3 percent for each of the three quarters so far reported for 2019. As of the third quarter of 2019, USAFacts.org reports that real GDP reached $19.1 trillion, or $58,000 per person.
- The net worth of American households grew 58 percent from the recession low of $68 trillion ($577,000 per household) in the first quarter of 2009, to $107 trillion ($881,000 per household) in the second quarter of 2019, based on inflation-adjusted data from the Federal Reserve.
- The U.S. economy expanded for a record 126th straight month in December, the longest expansion on record. And the country finished an entire decade without entering a recession, for the first time ever, according to a CNBC report.
Weaknesses
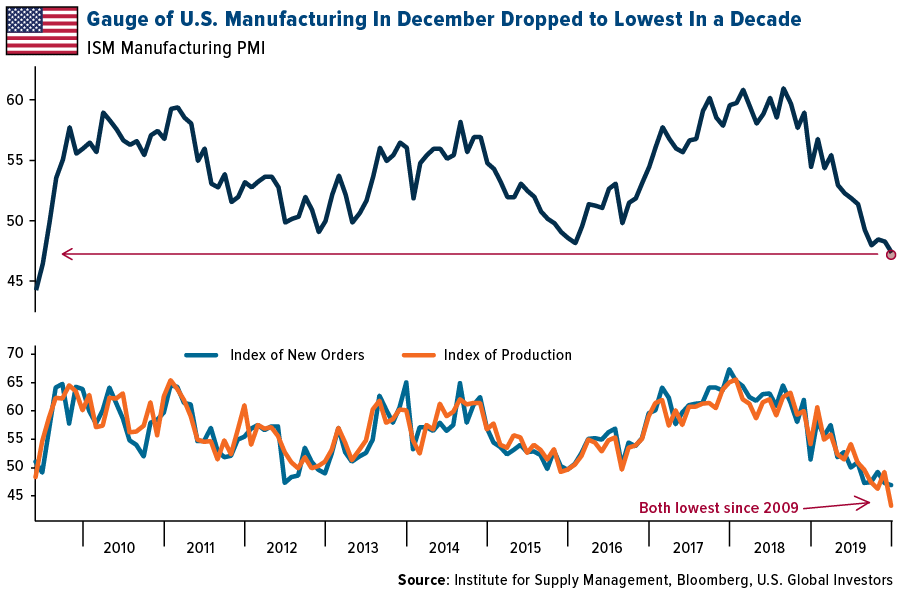
- U.S. manufacturing closed out the year with the weakest monthly performance since the end of the recession, with orders shrinking and factories continuing to dial back production. The Institute for Supply Management’s purchasing managers’ index (PMI) fell to 47.2 in December from 48.1, the fifth straight month of contraction and missing estimates for a gain, according to a report Friday.
- The global economy recorded its weakest growth in the past 10 years, according to the International Monetary Fund. Rising trade tensions, poor business climate, and activity, as well as country-specific weaknesses in emerging markets, were been a significant drag on global growth in 2019.
- The global slowdown and trade risks weighed on business confidence in the United States. The trade war with China, in particular, led U.S. firms to slow their investment decisions in 2019. “Business equipment investment remains weak, related to the global slowing in manufacturing activity,” Citigroup economists wrote in a global economic outlook report.
Opportunities
- The aerospace and defense industries look to be on good footing going into 2020. Spending is projected to grow in relation to increasing fuel efficiency and, within defense, exploring and countering new areas of threat including hypersonic weapons and cyber security.
- Transportation infrastructure could very well be another growth area in 2020. Capex is forecast to remain significant, mainly to address capacity constraints, tightening emissions regulations, and digitalization, including continued conversion by roads to all-electronic toll collection.
- S&P Global’s outlook for U.S. homebuilding credit quality has shifted to a positive bias, with support from a continued favorable, but uneven, national housing market. They believe positive rating actions could outnumber negative ones in 2020. On a related note, home prices in 20 U.S. cities rose at the best pace in five months in October, posting a second straight acceleration as real estate markets showed fresh strength at the start of the fourth quarter. This is good news heading into 2020.

Threats
- Oil jumped toward $70 a barrel in London after a U.S. airstrike ordered by President Trump killed a top Iranian general in Iraq, intensifying fears of conflict in the world’s most important crude-producing region.
- With credit markets increasing premiums attached to the most risky credits over the past year, even as yields remained exceptionally low and the hunt-for-yield continued, it isn’t surprising that credit market risks have been flagged by some sectors in relation to access to financing and the vulnerabilities of the most speculative credits. This includes sectors already under intense pressure like retail and oil and gas, as well as metals and mining where a maturity wall looms in 2022 and 2023 and where the proportion of speculative-grade issuers is among the highest.
- Given the burden of new regulations and costs, many sectors report pressure on margins, writes S&P Global. This is being met with cost-cutting, pressure on suppliers, and consolidation efforts, but is another example of why zero interest rates and continued economic growth are not translating as positively as hoped for to corporate sector performance, the report explains.
Energy and Natural Resources Market
Strengths
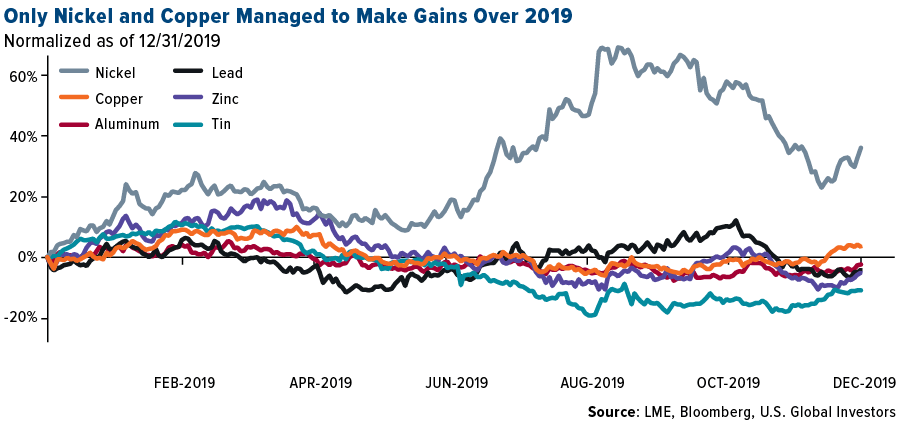
- The best performing commodity for 2019 was palm oil, rising 36.80 percent. For the week, iron ore had the best returns with a 3.35 percent gain. Nickel was the best industrial metal with an annual gain of 31.55 percent. Commodities overall are set to cap their strongest annual performance since 2016, reports Bloomberg, with crude to copper posting annual gains. The Bloomberg Commodity Spot Index, in fact, has hit the highest since November 2018 as of January 2, as trade tensions ebb, a risk-on mood sweeps markets, and the dollar eases, the article continues.
- Copper pared its gain as the People’s Bank of China cut the amount of cash that lenders must hold in reserve, reports Bloomberg, injecting funds into the economy and signaling continued action to reduce borrowing costs for companies. Despite the news, and as the chart below shows, both copper and nickel were the only two base metals that managed to end 2019 with positive performance.
- Oil prices were up around 35 percent by the last day of 2019, as OPEC and its allies cut production and a trade deal between Washington and Beijing neared, Bloomberg explains, even though futures slid as New York traders took profits. In addition, oil rose for a fifth straight session, the longest run of gains since July 2019, as a bigger-than-forecast decline in U.S. crude stockpiles eased oversupply concerns.
Weaknesses
- The worst performing commodity for 2019 was natural gas, falling 26.98 percent. In addition, natural gas was the worst performing commodity for the week with a loss of 5.02 percent. Milder winter weather and record production have kept prices low.
- The Institute for Supply Management’s gauge of U.S. manufacturing in December dropped to the lowest in a decade, reports Bloomberg, as the PMI reading came in at 47.2. This is the weakest monthly performance since the end of the recession. Stocks and Treasury yields (already lower following a U.S. airstrike killing one of Iran’s most powerful military leaders), extended declines after the report. U.S. consumer confidence fell in the month of December as well, Bloomberg reports, coming in at 126.5 versus 126.8 in the prior month and missing consensus estimates for a forecasted gain in the reading.
- Mexico’s national oil company was pushing to drill new wells at 20 “priority” fields using smaller, local service providers, reports Bloomberg, but that plan could now be faltering. The company is now expecting to re-bid some of the work in the year ahead. “They were supposing that they could bring these fields online quicker, but they haven’t,” said Jorge Sierra, senior analyst at Wood Mackenzie. “The contractors that won the packages for drilling the priority fields haven’t had the experience of managing integrated service contracts, like the big international ones.”
Opportunities
- Hedge funds ended the year more optimistic on global oil prices than they’ve been since May, Bloomberg reports. Data released on Friday show that their net-bullish wagers on Brent crude climbed for the ninth week in 10, reaching a seven-month high. “It’s a disaster waiting to happen,” said Bob Yawger at Mizuho Securities USA. “We’re seeing the largest net-long speculative position” in both West Texas Intermediate and Brent in seven months, he said.
- Demand for ethanol in Brazil is soaring due to its domestic demand for biofuels, largely made from sugar. Costs to produce ethanol in the U.S. are now cheaper than market prices in Brazil, even with the 20 percent tariff for importing. With Brazilian sugar cane in the off season, U.S. supplies may be able to fill that demand.
- Chinese copper stocks are returning to favor as the outlook for demand brightens, reports Bloomberg. A late spurt delivered the best annual gain in half a decade for the largest, Jiangxi Copper Co. As the article clarifies, what had ailed the red metal for most of 2019 largely dissipated last month as the U.S. and China closed in on an interim trade deal that will steady the global economy.
Threats
- One of the world’s biggest crop traders, Bunge Ltd., is exiting the U.S. ethanol production as competition and poor margins continue to squeeze Bunge, writes Bloomberg. The New York-based company sold its minority stake for $18 million to Southwest Iowa Renewable Energy LLC as returns for producing the fuel dropped into negative territory for much of the past year, as reported according to calculations by Iowa State University.
- In November 2015, 19 people were killed when an earthen wall holding back mining waste collapsed in Brazil. Vale SA, which co-owned the mine, vowed at that time to improve safety at dozens of other dams. However, just 20 months later, it happened again – but worse. As Bloomberg recounts, the collapse of Vale’s mine-waste dam at the start of 2019 killed 270 people. According to the article, while the company did increase spending on dam safety after the 2015 incident to meet new regulations, it hid structural concerns at the Brumadinho site from government inspectors and the local community, according to investigators, contractors and a report by the industry’s regulator.
- Apparently it’s not as easy as it sounds to pay your property taxes in nickels. One Missouri woman found out the hard way, reports Fox News. Hoping to protest the increase in her property taxes, Cynthia Lockett hatched a plan to pay her bill in nickels after multiple phone calls to appeal her increased land value assessment went unanswered. Hoping to inconvenience officials by paying her bill in rolls of nickels, Lockett soon found out the county actually has a long-standing statute preventing it from accepting large payments in coins.

Emerging Europe
Strengths
- Greece was the best performing country for 2019, gaining 52.5 percent. After years of austerity measures and bailout programs, Greek’s economy is improving. Its new government is pro-business, cutting taxes and pushing forward with the planned reforms, while maintaining high primary surplus. Greek banks are reducing bad loans. Investors’ confidence is slowly coming back. Greece has the world’s strongest manufacturing sector. According to Prime Minister Kyriakos Mitsotakis, Greece can regain investment grade status by the end of the first half of 2021.
- The Russian ruble was the best performing currency for 2019, gaining 12.5 percent. Last year the ruble was supported by high real rates and strong Brent crude oil price performance. The central bank of Russia cut rates five times in 2019, but the main rate remained at a high level of 6.25 percent in December while inflation dropped to 3 percent in December from 5 percent at the beginning of 2019. The price of Brent increased by 25.6 percent over the past 12 months.
- Communication services was the best performing sector among eastern European markets this week.
Weaknesses
- Poland was the worst performing country for 2019, losing 2.6 percent. Court reforms implemented by the ruling Law & Justice party sparked criticism from the eurozone. The European Court of Justice (ECJ) ruled that Poland broke the EU law by implementing the judicial reforms, deepening the disagreement between Poland and Brussels. Moreover, banks’ large foreign loan exposure, mostly to Swiss franc, captured more attention this year. Polish lenders, which are heavily weighted in the Warsaw Stock Exchange index, underperformed in the past 12 months.
- The Turkish lira was the worst performing currency in the region for 2019, losing 11 percent. The currency has underperformed for years and 2019 was no different. Domestic politics and international geopolitical developments pushed the lira lower. Turkey purchased a military defense system from Russia, and in response, the United States imposed sanctions on Turkey. The country’s incursion into northern Syria also sparked international criticism.
- Industrials was the worst performing sector among eastern European markets this week.
Opportunities
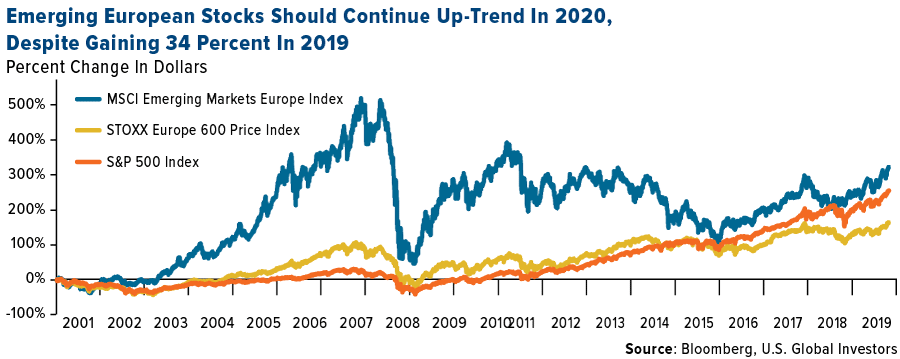
- The MSCI Emerging Markets Europe Index gained 33.6 percent in 2019 and many investors may wonder if the strong up-trend will continue in 2020. Looking at a longer price performance chart of the index compared to the U.S. market (SPX Index) and Western Europe (SXXP Index), one can clearly see that emerging European stocks are lagging. They never passed the pick from the May 2008 level, just before the 2008 crash, while the U.S. and Western European stocks surpassed it by far. A short-term correction may be expected. However, in the longer-term, emerging European equites should appreciate further despite strong gains in 2019.
- JPMorgan in its Global Asset Allocation research – “Top 10 trades for 2020” recommends overweighting Russia. Sustainable dividend yields and stable earnings per share forecasts are the mains reasons for this investment thesis. With negative bond yields around the world, Russia will remain a very attractive market for investors looking for higher yielding assets. Moreover, the group predicts a stable oil price, especially after the latest OPEC agreement, which should push the Moscow exchange higher.
- According to Wood & Company research, the Polish stock market is likely to record inflows next year thanks to employer-sponsored pension programs PKK, a new form of additional pension saving. Assuming 40 percent participation in the program, the inflows might reach PLN 1.6 billion next year and PLN 3.2-3.4 billion in 2021. The Warsaw stock exchange underperformed in 2019 and next year could be a turning point.
Threats
- The Prime Minister of Great Britain won the snap elections in December and that most likely will result in the U.K. leaving the European Union on January 31, 2020. This date will mark the beginning of important negotiations over how the separation will work in practice. Under current agreement, the U.K. will have until December 31, 2020 to find a common ground with the EU on issues like a trade deal. It took three and a half years for the U.K. to exit the EU (if it happens January 31, 2020), and it could be too optimistic to assume that the negotiations will end by the end of 2020. A hard Brexit is not completely out of the picture.
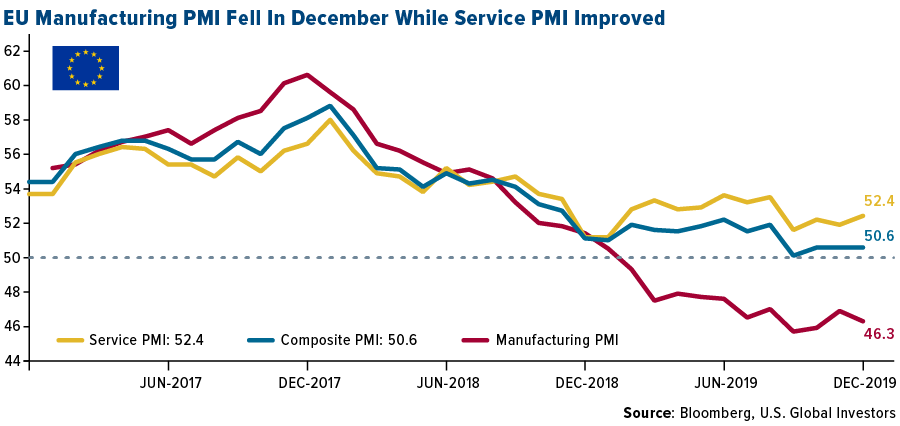
- Eurozone Manufacturing PMI fell in the month of December after two consecutive upticks in the month of September and October. In the year 2019, the manufacturing activity indicator for the eurozone dropped to 46.3 from 51.4 resulting in slower economic growth. However, the service PMI improved in the month of December, helping the composite reading stay above the 50 level that separates contraction from expansion.
- This year the eurozone will set its next multiyear budget for 2021-2027. Currently, Poland and Hungary are the biggest beneficiaries of EU funds, but the EU threatened both countries saying the allocations will not be as large going forward. The European Commission accused both countries of undermining judicial independence and breaking democratic values.
China Region
Strengths
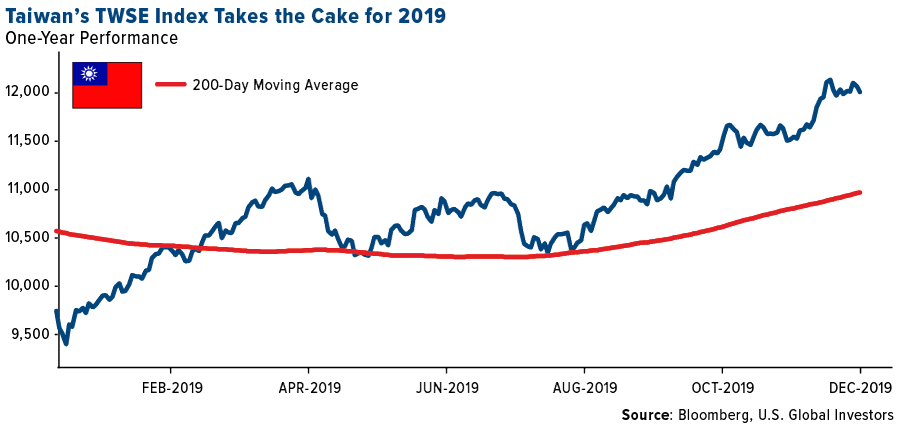
- The best performing index around the region was Taiwan’s TWSE, which jumped 28.79 percent in 2019, beating out Shanghai’s sturdy (but second-best) 25.30 percent return for the year. India, Hong Kong and Vietnam also returned double-digits for calendar year 2019.
- Information technology was the top performing Hang Seng Composite Index sector in Hong Kong, rising 23.75 percent amid gradually cooling trade tensions and a rebound from last year.
- With the exceptions of Indonesia and Hong Kong, the rest of the region has perked up, with manufacturing PMIs rising once again above 50.0 and marking expansion even as stimulus expands and trade war concerns take a back seat heading into 2020.
Weaknesses
- The good news is that while almost every index around the region was up on the year, the bad news is that Malaysia was the lone one down in the red, falling by 2.83 percent over the course of 2019’s trading. Indonesia, Thailand, the Philippines, South Korea and Singapore all had single-digit returns on the year.
- Telecommunications was the poorest performing HSCI sector for 2019, dropping by 9.69 percent.
- Hong Kong’s de facto status as a U.S. trading partner may remain unchanged at present, but de jure it suffered a setback when Congress scaled back its privilege to require annual certification by the U.S. State Department that the city remains sufficiently autonomous from Beijing. And while the SAR’s special trading status has hardly been revoked, the gesture was certainly a bit of a slap in the face to Beijing. Hong Kong’s protests—and governmental responses—caused controversy the world round this year, from the NBA to college campuses to Congress, and obviously, far outside the boundaries of this country as well.
Oppurtunites
- Here’s an opportunity we’ve highlighted for a while and one that remains despite a recent rise in Hong Kong’s equities markets: the city’s blue chip Hang Seng Index still stands at a P/E/ ratio of only 11.14. The S&P 500, on the other hand, stands at a P/E ratio of 21.63. Should Hong Kong’s issues or trade war tensions thaw further, might markets melt up in developed Hong Kong? The HSI rose more than 8 percent off its lows in December into the end of the year, for example, and has not yet recovered the highs of earlier 2019. Neither has Shanghai. China is stimulating, reserve ratios were cut this week on the mainland, and a Phase One deal-signing is reportedly imminent. Global equities did soar, in general, into the end of the year, but Hong Kong arguably remains cheaper than many other global markets, and is almost certainly geared toward any China recovery and trade war thaw. What’s your time horizon?
- One intriguing opportunity is the continued debut of foreign-listed mainland Chinese companies back closer to home, especially in Hong Kong. After Alibaba’s IPO in Hong Kong—surely charting a very public course for how to hedge some of the risks of the trade war and/or increasing scrutiny and sentiment in the West over Chinese technology and infrastructure—other companies are likely to follow. Talk in 2019 of possible U.S. portfolio flow restrictions on money into Chinese listings may have been no more than a shot across the bow, but it may well also be highly indicative of the rising state of overall tension between Chinese and U.S. strategic and economic interests. Why leave anything to chance? Alibaba wondered, before subsequently doing something about it. The latest reports this week suggest that HKEX may well be in talks to see Trip.com (formerly Ctrip.com) and Netease list in HK as well. Other ADRs could very likely follow. Thus somewhat ironically, while long-term tension between the U.S. and China on certain matters (and indeed, perhaps even many matters) may increasingly be the status quo—and despite some of the troubles of Hong Kong of late—there may well be a silver lining for that powerful financial hub in its long-standing status as “Asia’s World City” and as the financial gateway to China: when Chinese companies consider putting one foot back home closer to Beijing and the Chinese mainland, Hong Kong likely remains the best locale from which to do so, protests or not. Now, there’s some food for thought in 2020…
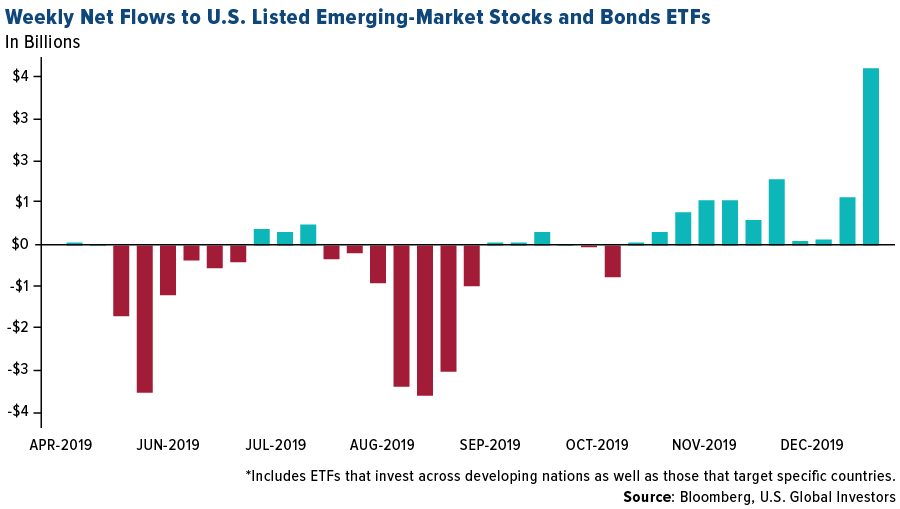
- And speaking of money flows heading into 2020, take a look at the chart below, which maps out recent weekly flows to U.S.-listed emerging market stocks and bond ETFs.
Threats
- A threat of some significance heading into 2020 remains the ongoing state of protests and disruptions in and around Hong Kong, which have weighed heavily on tourism and retail sales throughout the back end of 2019 in that SAR. The most recent retail sales numbers from Hong Kong, in fact, show a more-than-23 percent year-over-year drop for the November period, the most recent reading. It also remains true that much life in the city does appear to get on with things anyway, commerce continues, and there are some—including HK CEO Carrie Lam, obviously, and many in her government—that take issue with the protest and protesters and their mostly-as-yet-unmet demands. But at the end of the day, there are a couple of major dynamics to consider here heading into 2020 on the issue of Hong Kong and the protests. First, think of China: Is that East Asian behemoth not playing the long game? Consider the “lease” of Hong Kong to the British at the end of the nineteenth century and the increasing proximity to the mid twenty-first, when “One country, Two systems” policy is officially slated to end anyway. Are the Chinese not closer now in time than ever to 2047? If one thinks about the long game, are not protests, financial cycles, political ups and downs, etc. all just potentially so much noise en route to “One country, period?” Bear this dynamic in mind when assessing Hong Kong from a geopolitical perspective. Consider also the economic might of Shenzhen, the rising Xi Jinping-sanctioned attention and infrastructural (now maybe financial, also?) connectivity with Macau and across the Greater Bay Area, and ask yourself: if Hong Kong has no true vote even at home, does it really have much say over or against these other trends? Clearly, Beijing means to lessen dependency on Hong Kong and “de-risk” from it as much as possible—that much, at least, is patently obvious. Now, for the second dynamic to bear in mind in assessing Hong Kong: the short game. This is where pro-democracy protests, in a U.S. election year, with rising anti-China sentiment across Congress and amid a (currently paused?) trade war matter much more for the short-term-focused markets. Other shorter-term concerns also matter in this realm: Is global growth slowing? Can monetary policy guide us along properly? Will the U.S. and China play nicely for a little while now? And, perhaps more pressing for Hong Kong—where the Umbrella Protests really don’t seem like all that long ago, because they really weren’t, and people (especially younger ones) seem rather restless amid this new round of largely leaderless pro-democracy protests—how exactly does the protest situation unwind? It remains remarkable that Lam backed down on the extradition bill; other protestor demands may be less easily accomplished. So again, at the end of the day, the protests remain something of a threat, and there may well be long- or short-term effects that ultimately derive from them, but so too, bear in mind that for Hong Kong—and its people—the longer-term issues are nothing new, Beijing’s rising strength is not surprising, and, despite all the hullabaloo around the initial British handover in ’97, Hong Kong went on not only to survive but thrive amid the tensions. The city has been through a lot before, and Hong Kong may well collectively be playing its own long game, as well, in its own way. Perhaps a solid bounce may even be in order.
- One threat we must consider is the possibility of a return to trade war hostilities down the road—or at least the perception of a return to hostilities—before a larger “Deal” may be done. One can make the case that another term for Phase One is also incomplete, or unfinished, which is simply the logical flipside of a very positive development of late. Is it good? Yes, it seems to be so. But is a larger deal done? No. Consensus had been building for quite some time that any larger discussions and deal-making may well need to wait until after the U.S. elections. Thus the U.S. and China may well conclude the recent economic hostilities with a cheery sort of Phase One agreement, and perhaps that does indeed pave the way for broader cooperation and later “Phases” down the road post U.S. 2020 election. But if it doesn’t—or if the rhetoric or tariffs start creeping back, it could well rattle markets easily.
- Quietly—or perhaps not, if you’ve kept up with the steady drumbeat of global technology news and infrastructure and cybersecurity concerns—the pressure to choose sides between Huawei and the West continues, and may feature prominently in 2020. The U.S. is vocal about its security concerns, continues to pressure its allies not to incorporate Huawei 5G infrastructure or else risk intelligence-sharing pacts and arrangements with the United States, and continues to seek extradition from Canada of Huawei’s CFO in the meantime. The UK and Germany, among others, have challenging (or perhaps not, perhaps you think them obvious) choices to make, choices that may reverberate for years to come in ways we don’t yet fully grasp. This “race” won’t be won overnight by either “side,” but—as we saw at the height of the trade war and with ZTE, for a time—there may always be winners and losers, casualties or trends, that materialize along the way.
Blockchain and Digital Currencies
Strengths
- Of the cryptocurrencies tracked by CoinMarketCap, the best performing for the week ended January 3 was BlockStamp, up 1,520 percent.
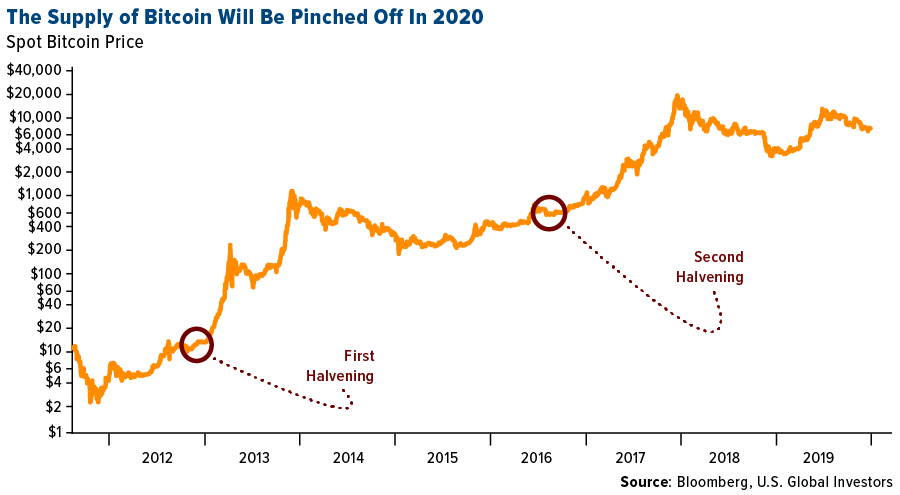
- Bitcoin believers are expecting a 2020 rally in the popular digital currency, reports Bloomberg, as a direct response to halving on or around May 18. After the block payment was cut back in 2012 (with the reward going from 50 to 25 bitcoins), prices rallied 8,200 percent in a year. Similarly, the gain in the following 18 months after the second halvening in 2016 was more than 2,200 percent.
- Did you know bitcoin has seen a rise of 9,000,000 percent this decade? That, according to one Bloomberg article which points out the digital currency’s gains since July 2010. As the article points out, even with its huge run-up and subsequent mega-crash, bitcoin leaves all others in the dust.
Weaknesses
- Of the cryptocurrencies tracked by CoinMarketCap, the worst performing for the week ended January 3 was Xensor, down 77.98 percent.
- Responding to allegations that it intentionally deleted cryptocurrency educational videos from its platform, YouTube is now saying it “made the wrong call.” Apparently the group erroneously purged the content, but this week claims to have reinstated it. Content creators, however, are telling a different story, writes CoinDesk.
- Despite numerous benefits provided by blockchain technology that has incentivized businesses and governments to adopt, explore or invest in it, CoinTelegraph reports that funding for blockchain startups has actually dried up. After incoming funds peaked in 2018 with $5.5 billion in capital raised, the article explains, 2019 saw a sharp decline – with less than $3 billion of capital flowing into the ecosystem.
Opportunities
- China could be getting its first blockchain exchange-traded fund (ETF), reports CoinDesk. The Asian nation’s financial watchdog known as the China Securities Regulatory Commission (CSRC), has recently received an application for listing the ETF, which will track blockchain-related stocks as well as underlying assets. The fund will be known as the Penghua Shenzen Stocks Blockchain ETF and the application was filed by asset management firm Pengua Fund.
- According to News.Bitcoin.com, the number of Israeli blockchain companies grew by 32 percent last year. This, despite harsh market conditions in 2019 along with high profile closures of a few ventures as well as a lot of employee downsizing. At the end of 2018 there were around 113 active blockchain and crypto companies in Israel, but at the end of 2019, 150 were in existence.
- On Thursday, the Guangdong government launched a blockchain-based financing platform, reports CoinDesk. The aim will be to help small companies in the region receive loans faster from commercial banks.
Threats
- Ethereum developer Virgil Griffith was being held behind bars for allegedly violating the International Emergency Economic Powers Act by traveling to North Korea for a cryptocurrency conference organized by the government of Pyongyang, writes CoinDesk. However, now Griffith is slated to be released to his parents’ home in Alabama pending pre-release conditions, following a ruling by U.S. District Court Judge Vernon Broderick in New York on Monday.
- A January 3 press release from the U.S. Attorney’s Office for the Eastern District of New York, reports that a U.S. citizen has been charged with heroin and methamphetamine distribution in exchange for bitcoin. As CoinTelegraph goes on to explain, Joanna De Alba allegedly promoted and sold illegal narcotics on a dark web marketplace dubbed the “Wall Street Market,” between June 2018 and May 2019.
- The U.S. Securities and Exchange Commission (SEC) filed a court order on January 2 to “compel the messaging platform Telegram into releasing details of how the funds raised in its ICO have been spent,” writes CoinTelegraph. According to the SEC, these requested records are important as they are highly relevant to an ongoing case against Telegram. The case alleges that the $1.7 billion raised selling Gram tokens constituted an unregistered securities sale.

Leaders and Laggards
| Index | Close | Weekly Change($) |
Weekly Change(%) |
|---|---|---|---|
| 10-Yr Treasury Bond | 1.79 | -0.09 | -4.69% |
| Oil Futures | 62.99 | +1.27 | +2.06% |
| Hang Seng Composite Index | 3,874.67 | +40.18 | +1.05% |
| S&P Basic Materials | 374.88 | -9.62 | -2.50% |
| Korean KOSPI Index | 2,176.46 | -27.75 | -1.26% |
| S&P Energy | 458.77 | +3.81 | +0.84% |
| Nasdaq | 9,020.77 | +14.15 | +0.16% |
| DJIA | 28,634.88 | -10.38 | -0.04% |
| Russell 2000 | 1,660.86 | -8.17 | -0.49% |
| S&P 500 | 3,234.85 | -5.17 | -0.16% |
| Gold Futures | 1,551.30 | +33.20 | +2.19% |
| XAU | 105.41 | +0.28 | +0.27% |
| S&P/TSX VENTURE COMP IDX | 587.44 | +23.86 | +4.23% |
| S&P/TSX Global Gold Index | 259.23 | +0.02 | +0.01% |
| Natural Gas Futures | 2.12 | -0.04 | -1.81% |
| Index | Close | Monthly Change($) |
Monthly Change(%) |
|---|---|---|---|
| Korean KOSPI Index | 2,176.46 | +107.57 | +5.20% |
| 10-Yr Treasury Bond | 1.79 | +0.01 | +0.79% |
| Gold Futures | 1,551.30 | +71.10 | +4.80% |
| S&P Basic Materials | 374.88 | +5.81 | +1.57% |
| S&P 500 | 3,234.85 | +122.09 | +3.92% |
| DJIA | 28,634.88 | +985.10 | +3.56% |
| Nasdaq | 9,020.77 | +454.10 | +5.30% |
| Oil Futures | 62.99 | +4.56 | +7.80% |
| Hang Seng Composite Index | 3,874.67 | +324.57 | +9.14% |
| S&P/TSX Global Gold Index | 259.23 | +12.43 | +5.04% |
| XAU | 105.41 | +7.90 | +8.10% |
| Russell 2000 | 1,660.86 | +46.97 | +2.91% |
| S&P Energy | 458.77 | +27.29 | +6.32% |
| S&P/TSX VENTURE COMP IDX | 587.44 | +47.74 | +8.85% |
| Natural Gas Futures | 2.12 | -0.28 | -11.67% |
| Index | Close | Quarterly Change($) |
Quarterly Change(%) |
|---|---|---|---|
| XAU | 105.41 | +16.09 | +18.01% |
| S&P/TSX Global Gold Index | 259.23 | +18.19 | +7.55% |
| Gold Futures | 1,551.30 | +30.80 | +2.03% |
| DJIA | 28,634.88 | +2,433.84 | +9.29% |
| S&P 500 | 3,234.85 | +324.22 | +11.14% |
| Nasdaq | 9,020.77 | +1,148.51 | +14.59% |
| Korean KOSPI Index | 2,176.46 | +144.55 | +7.11% |
| Natural Gas Futures | 2.12 | -0.21 | -9.02% |
| S&P Basic Materials | 374.88 | +23.78 | +6.77% |
| Russell 2000 | 1,660.86 | +174.51 | +11.74% |
| Oil Futures | 62.99 | +10.54 | +20.10% |
| Hang Seng Composite Index | 3,874.67 | +364.00 | +10.37% |
| S&P/TSX VENTURE COMP IDX | 587.44 | +29.66 | +5.32% |
| S&P Energy | 458.77 | +37.61 | +8.93% |
| 10-Yr Treasury Bond | 1.79 | +0.25 | +16.55% |
U.S. Global Investors, Inc. is an investment adviser registered with the Securities and Exchange Commission ("SEC"). This does not mean that we are sponsored, recommended, or approved by the SEC, or that our abilities or qualifications in any respect have been passed upon by the SEC or any officer of the SEC.
This commentary should not be considered a solicitation or offering of any investment product.
Certain materials in this commentary may contain dated information. The information provided was current at the time of publication.
Some links above may be directed to third-party websites. U.S. Global Investors does not endorse all information supplied by these websites and is not responsible for their content.
Holdings may change daily. Holdings are reported as of the most recent quarter-end. The following securities mentioned in the article were held by one or more accounts managed by U.S. Global Investors as of (09/30/2019):
Newmont Goldcorp Corp.
TriStar Gold Inc.
Alamos Gold Inc.
*The above-mentioned indices are not total returns. These returns reflect simple appreciation only and do not reflect dividend reinvestment. The Dow Jones Industrial Average is a price-weighted average of 30 blue chip stocks that are generally leaders in their industry. The S&P 500 Stock Index is a widely recognized capitalization-weighted index of 500 common stock prices in U.S. companies. The Nasdaq Composite Index is a capitalization-weighted index of all Nasdaq National Market and SmallCap stocks. The Russell 2000 Index® is a U.S. equity index measuring the performance of the 2,000 smallest companies in the Russell 3000®, a widely recognized small-cap index. The Hang Seng Composite Index is a market capitalization-weighted index that comprises the top 200 companies listed on Stock Exchange of Hong Kong, based on average market cap for the 12 months. The Taiwan Stock Exchange Index is a capitalization-weighted index of all listed common shares traded on the Taiwan Stock Exchange. The Korea Stock Price Index is a capitalization-weighted index of all common shares and preferred shares on the Korean Stock Exchanges. The Philadelphia Stock Exchange Gold and Silver Index (XAU) is a capitalization-weighted index that includes the leading companies involved in the mining of gold and silver. The U.S. Trade Weighted Dollar Index provides a general indication of the international value of the U.S. dollar. The S&P/TSX Canadian Gold Capped Sector Index is a modified capitalization-weighted index, whose equity weights are capped 25 percent and index constituents are derived from a subset stock pool of S&P/TSX Composite Index stocks. The S&P 500 Energy Index is a capitalization-weighted index that tracks the companies in the energy sector as a subset of the S&P 500. The S&P 500 Materials Index is a capitalization-weighted index that tracks the companies in the material sector as a subset of the S&P 500. The S&P 500 Financials Index is a capitalization-weighted index. The index was developed with a base level of 10 for the 1941-43 base period. The S&P 500 Industrials Index is a Materials Index is a capitalization-weighted index that tracks the companies in the industrial sector as a subset of the S&P 500. The S&P 500 Consumer Discretionary Index is a capitalization-weighted index that tracks the companies in the consumer discretionary sector as a subset of the S&P 500. The S&P 500 Information Technology Index is a capitalization-weighted index that tracks the companies in the information technology sector as a subset of the S&P 500. The S&P 500 Consumer Staples Index is a Materials Index is a capitalization-weighted index that tracks the companies in the consumer staples sector as a subset of the S&P 500. The S&P 500 Utilities Index is a capitalization-weighted index that tracks the companies in the utilities sector as a subset of the S&P 500. The S&P 500 Healthcare Index is a capitalization-weighted index that tracks the companies in the healthcare sector as a subset of the S&P 500. The S&P 500 Telecom Index is a Materials Index is a capitalization-weighted index that tracks the companies in the telecom sector as a subset of the S&P 500. The NYSE Arca Gold Miners Index is a modified market capitalization weighted index comprised of publicly traded companies involved primarily in the mining for gold and silver. The Consumer Price Index (CPI) is one of the most widely recognized price measures for tracking the price of a market basket of goods and services purchased by individuals. The weights of components are based on consumer spending patterns. The Purchasing Manager’s Index is an indicator of the economic health of the manufacturing sector. The PMI index is based on five major indicators: new orders, inventory levels, production, supplier deliveries and the employment environment. The S&P/TSX Venture Composite Index is a broad market indicator for the Canadian venture capital market. The index is market capitalization weighted and, at its inception, included 531 companies. A quarterly revision process is used to remove companies that comprise less than 0.05% of the weight of the index, and add companies whose weight, when included, will be greater than 0.05% of the index. Gross domestic product (GDP) is the monetary value of all the finished goods and services produced within a country’s borders in a specific time period, though GDP is usually calculated on an annual basis. It includes all of private and public consumption, government outlays, investments and exports less imports that occur within a defined territory.
The MSCI Emerging Markets Europe Index is a free float-adjusted market capitalization index that is designed to measure equity market performance in the emerging markets countries of Europe (Czech Republic, Hungary, Poland, Russia, and Turkey). The STOXX Europe 600 Index is derived from the STOXX Europe Total Market Index (TMI) and is a subset of the STOXX Global 1800 Index. With a fixed number of 600 components, the STOXX Europe 600 Index represents large, mid and small capitalization companies across 18 countries of the European region: Austria, Belgium, Czech Republic, Denmark, Finland, France, Germany, Greece, Ireland, Italy, Luxembourg, the Netherlands, Norway, Portugal, Spain, Sweden, Switzerland and the United Kingdom. The Warsaw Stock Exchange mWIG40 Index (MIDWIG) is a modified capitalization-weighted index of 40 Polish stocks which are listed on the main market of the Warsaw Stock Exchange. The index excludes stocks from the WIG20, investment funds, and foreign companies. The base value was set to 1000 as of December 31, 1997. The Bloomberg Commodity Index is made up of 22 exchange-traded futures on physical commodities. The index represents 20 commodities, which are weighted to account for economic significance and market liquidity. The TWSE, or TAIEX, Index is a capitalization-weighted index of all listed common shares traded on the Taiwan Stock Exchange. The index was based in 1966. The index is also known as the TSEC Index.

