


Bitcoin Mining Uses a Higher Mix of Sustainable Energy Than Any Major Country or Industry
Date Posted: July 2, 2021
Read time: 50 min
Bitcoin death crosses have not historically been consistent downside price predictors. Take a look at the chart below, shared in a Tuesday tweet by CoinShares. The digital asset investing firm analyzed Bitcoin's price action one, three, six and 12 months following previous death crosses, and no pattern emerged suggesting that a sustained bear market was triggered when the 50-day MA dipped below the 200-day.
By Frank Holmes
CEO and Chief Investment Officer
U.S. Global Investors

On Thursday, HIVE Blockchain Technologies listed on Nasdaq (HVBT), providing U.S. investors access to Bitcoin and Ether mining.
As many of you know, HIVE became the first crypto miner to be traded publicly when it debuted on the TSX Venture almost four years ago. Its uplisting to Nasdaq, the world’s premiere tech stock exchange, represents the culmination of months of hard work by our team. I want to thank shareholders for their loyalty and patience.
That said, I believe the best is yet to come. We’re of the opinion that Ether 2.0 Proof of Stake (PoS) will take at least another two years before Ether mining is no longer financially attractive. That’s part of the reason why we’ve been expanding our enterprise cloud services focused on high-performance computing (HPC) workloads such as gaming, artificial intelligence (AI) and movie animation.
Toward that end, HIVE just agreed to join the NVIDIA Partner Network (NPN) as a cloud service provider, providing us access to the tech company’s ecosystem, partners, customers and deep industry expertise. We also substantially increased our computing capacity by buying NVIDIA graphics processing units (GPUs) with a total contract value of more than $66 million.
In the meantime, HIVE continues to hold its newly minted Bitcoin and Ether, mined using only 100% green renewable energy, in secure storage.
It’s important for investors to keep in mind that the crypto mining space is still incredibly volatile.
Whereas gold has a daily standard deviation of ±1%, Bitcoin has one of ±6%. By introducing our enterprise cloud service offerings, we hope to lower some of HIVE’s volatility while maintaining its attractive margins.
Bitcoin Network a Far Bigger Consumer of Sustainable Energy Than Fake News Reports
Besides being an NVIDIA cloud service provider, HIVE is proud to be a founding member of the Bitcoin Mining Council (BMC), the group conceived in May after recent talks between North American Bitcoin miners, Elon Musk and MicroStrategy co-founder and CEO Michael Saylor.
In the past couple of months, the global Bitcoin mining network has come under heightened scrutiny over its energy consumption. Critics, most notably Elon Musk, have tried making the case that Bitcoin uses an unacceptable amount of electricity generated by fossil fuels, with Musk going so far as to cancel Tesla’s policy of accepting the cryptocurrency as a form of payment.
Newly compiled research, though, proves just how unfounded these criticisms really are. In its very first report, the BMC released results of its survey of over 32% of the current global Bitcoin network, finding that participants are using electricity with a 67% sustainable power mix. Based on that data, the total sustainable power mix could be as high as 56%, making Bitcoin mining one of the most sustainable industries globally.
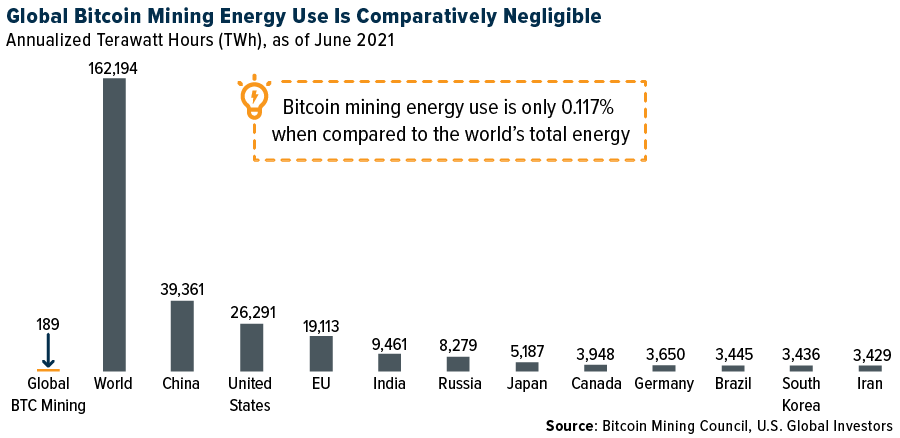
To put that in perspective, the U.S. currently uses electricity that’s only 30.5% sustainable. For China, that figure is less than 15%.
Take a look at the stunning chart below. Fake news makes Bitcoin out to be the biggest energy guzzler on the planet. On the contrary, its energy usage is negligible, as it consumes only 0.117% of total global electricity.
There may be many reasons why people spread misinformation about Bitcoin. Much of the misinformation may originate from Ripple, which is currently under investigation by the Securities and Exchange Commission (SEC). The fintech firm is believed to employ a great number of bots on Twitter and other social media platforms with the intent of tearing Bitcoin down in favor of its own XRP coin.
Expect Busy Roads and Skies this Fourth of July
This weekend marks America’s independence from Great Britain, and in many ways, it will also mark American families’ independence from the pandemic. The American Automobile Association (AAA) forecasts that holiday travel volume will rival that of 2019 volume, with 47.7 million people taking to the roads and skies. Car travel may even exceed 2019 levels.
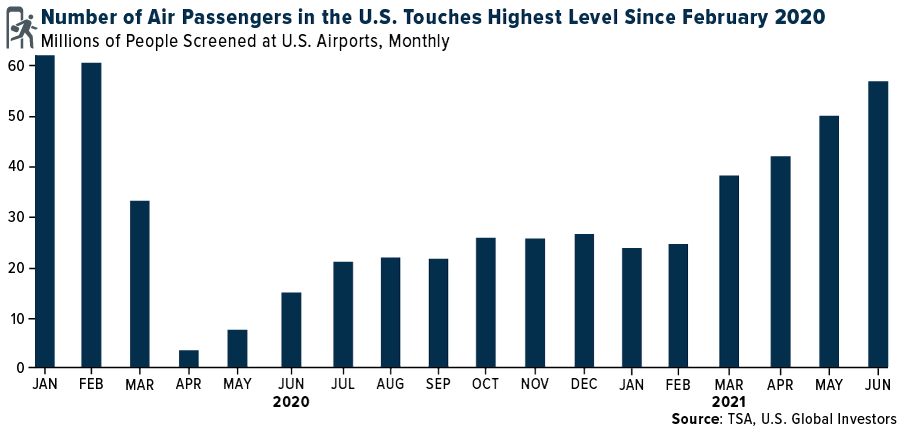
Air passenger traffic, meanwhile, is expected to reach 90% of 2019 volume, bringing it as close to pre-pandemic levels as we’ve seen so far. In June, more than 56.7 million people were screened at U.S. airports, the greatest amount since February 2020, soon before the entire world economy went into lockdown.
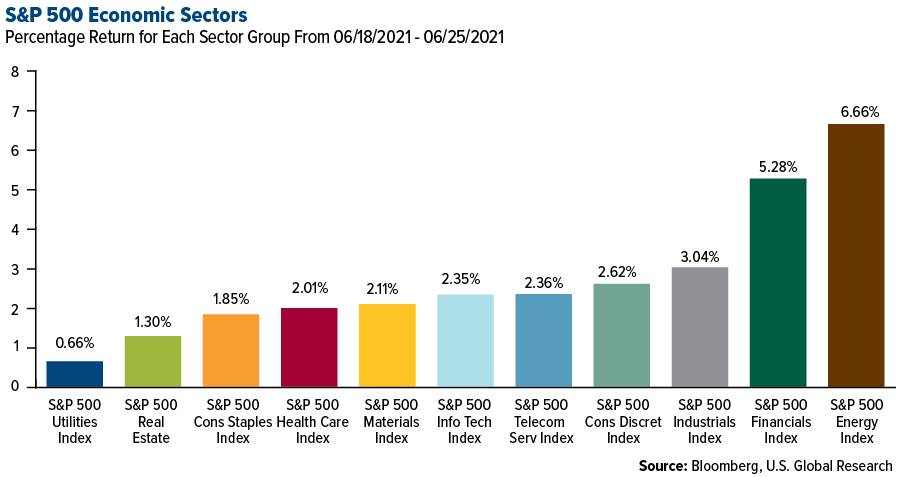
Unexpectedly strong demand is reflected in the performance of energy and manufacturing stocks in the first half of 2021. Among the leaders in the S&P 500 were oil exploration and production such as Marathon Oil (whose stock doubled in the six months ended June 30), Texas-based Diamondback Energy and Devon Energy, as well as manufacturers such as power generator-producer Generac and steel-producer Nucor.

Despite Labor Shortages, Factories Expanded at a Record Pace
All of this strong demand has put a strain on gas stations, some of which have already started seeing outages ahead of the July Fourth weekend. To be clear, this is the result of a labor shortage, not fuel shortage. According to National Tank Truck Carriers, the industry is short some 50,000 drivers right now.
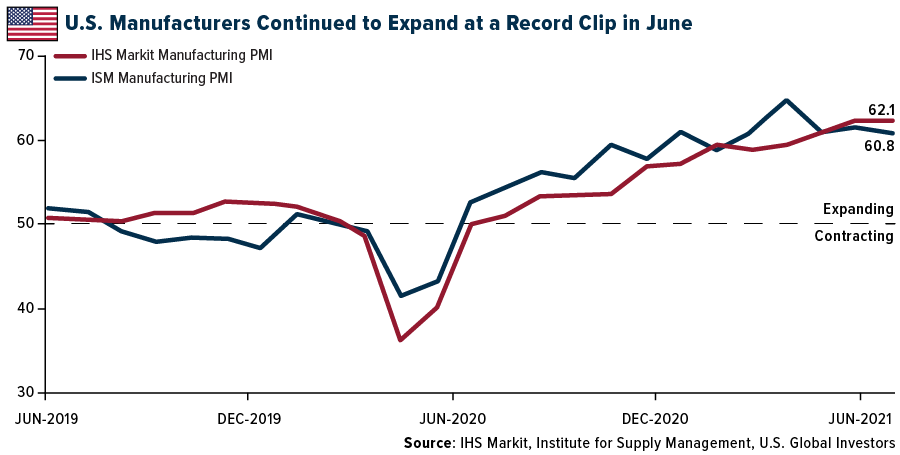
Factories both here and abroad also continue to experience a labor shortage as suppliers struggle to keep up with a wave of new orders. Nonetheless, factories reported very strong growth in June, with some surveys indicating record or near-record levels of expansion. The IHS Markit Manufacturing PMI came in at 62.1, unchanged from May’s record reading, while the ISM Manufacturing PMI dipped slightly from 61.2 to 60.6
One of the most exciting manufacturing orders in recent memory happened this week when United Airlines put in an order for an incredible 270 new aircraft, including 200 Boeing Max jets and 70 Airbus 321neos. This represents the carrier’s largest such order in company history, and I see it as extremely bullish not just for United and Boeing but the commercial airline industry as a whole. United is positioning itself to capture market share as vaccination rates rise, travel restrictions are lifted and economies fully reopen.
I hope my Canadian readers had a wonderful Canada Day on Thursday, and to my American friends and family, Happy Independence Day!

Index Summary
- The major market indices finished up this week. The Dow Jones Industrial Average gained 1.02%. The S&P 500 Stock Index rose 1.67%, while the Nasdaq Composite climbed 1.94%. The Russell 2000 small capitalization index lost 1.23% this week.
- The Hang Seng Composite lost 3.34% this week; while Taiwan was up 1.18% and the KOSPI fell 0.64%.
- The 10-year Treasury bond yield fell 10 basis points to 6.49%.
Airline Sector
Strengths
- The best performing airline stock for the week was Bangkok Airways, up 17.9%. Capacity levels are continuing to recover in the U.S. and worldwide as airlines accommodate higher traffic. Domestic capacity should be at 88%, 92%, and 93% of 2019 levels for June, July, and August, respectively. Global capacity should be at 51%, 60%, and 69% of 2019 levels for June, July, and August, respectively.
- Southwest Airlines is bullish on its future. The company has been able to return its fleet to the skies at a much more efficient rate than its competitors. Southwest also feels it has made great progress in adding fleet selectively, as traffic recovers in various city pairs. The airline did not furlough employees, so they can return to work easier. Lastly, Southwest is fully hedged to higher fuel prices.
- Air traffic continues to improve. TSA passenger throughput is now only down 25% from 2019 levels, which is an increase of 2% from the past week. European passenger throughput is now only down 48% from 2019 levels, which is an increase of 4% from the past week.
Weaknesses
- The worst performing airline stock for the week was Air Berlin PLC, down 35.1%. According to Bank of America, Cathay Pacific will face a long road of traffic recovery due to slow reopening of borders in its core markets. They do not see the airline as profitable until mid-2023. Bank of America sees Cathay Pacific’s traffic at 31% of normal levels by year-end and 45% of normal levels by the end of 2022.

- EasyJet’s stock continues to be weak, off by 11% in the last month and falling at present. There was a 90% drop in revenues with a 91% drop in traffic reported in recent results. The U.K. government’s recent green/amber/red coding for countries has contributed to travel uncertainty, hurting EasyJet.
- Stifel’s proprietary demand model predicts the risk of a demand slowdown for airlines. Demand sentiment has declined to levels just above the 0 standard deviation mark. This could be the result of concerns over the delta plus variant of COVID-19. Despite this, Stifel continues to see TSA throughput strengthen. COVID does remain a risk to air travel trends, particularly for the upcoming fall season.
Opportunities
- United Airlines ordered 270 Boeing and Airbus narrow body aircrafts, driving capital commitments to $35.9 billion as of May 31 of this year versus $24.3 billion as of December 31 of 2020. Capacity growth is expected to be 4% to 6% until 2026. This will allow the airline to accommodate higher traffic and grow. Also, the airline needs to modernize its fleet, as 431 of its aircrafts are 21 years of age or older.
- Corporate travel is showing some signs of resurgence. The number of tickets booked through corporate channels continue to steadily improve and are down only 57% versus 2019’s numbers. There are better trends in smaller travel agency data (-29% this week versus 2019), which supports the belief that a small to medium corporate travel recovery has begun well before large corporate travel recovery.
- Web traffic continues to improve for the airlines. U.S. airline industry web traffic increased 9% week-over-week (ninth consecutive weekly increase) to 17% growth versus 2019. European carrier web traffic increased 9% higher week-over-week (ninth week of growth) to down 22% versus 2019.
Threats
- There are still concerns about how leveraged European airlines will be due to travel restrictions still in place. Lower traffic forces airlines to burn cash in order to survive. The only airlines to say they are not burning cash currently are Lufthansa, Ryanair, and Wizz Air.
- The Financial Times reported that a U.S.-U.K. travel corridor is unlikely to happen before September. The article additionally indicates that Astra-Zeneca vaccinated people travelling from the U.K. to the U.S. may not qualify for the corridor until the FDA approves the Astra-Zeneca vaccine.
- Bank of America maintained its bearish stance on United despite the recent positive meeting. While the cost benefits of the fleet upgrade program are meaningful for United, the increased capex outlined will delay balance sheet improvement. By the end of 2023, United expects net debt to be $25 billion versus $24 billion today and $18 billion at the end of 2019. The airline will be spending another $8 billion of capex in 2024, so Bank of America views 2025 as potentially the first year that the airline will be able to begin making strids on improving its balance sheet.

Emerging Markets
Strengths
- The best performing country in emerging Europe for the week was Russia, gaining 0.90%. The best performing country in Asia this week was Taiwan, gaining 0.8%.
- The Turkish lira was the best performing currency in emerging Europe this week, gaining 1%. The Vietnamese dong was the best performing currency in Asia this week, gaining 0.07%.
- Europe’s manufacturing purchasing managers’ index (PMI) was reported higher in the month of June. It moved up to 63.4 from 63.1, a fresh record high fueled by stronger activity as the continent is improving its fight against the COVID-19 pandemic.
Weaknesses
- The worst performing country in emerging Europe for the week was Hungary, losing 1.9%. The worst performing country in Asia this week was Hong Kong, losing 3.2%.
- The Russian ruble was the worst performing currency in emerging Europe this week, losing 1.7%. The Philippine peso was the worst performing currency in Asia, losing 1.6%.
- China’s manufacturing PMI was reported lower in the month of June, sliding to 50.9 from 51. The Caixin PMI, which measures smaller private manufacturing activities dropped to 51.3 from 52.
Opportunities
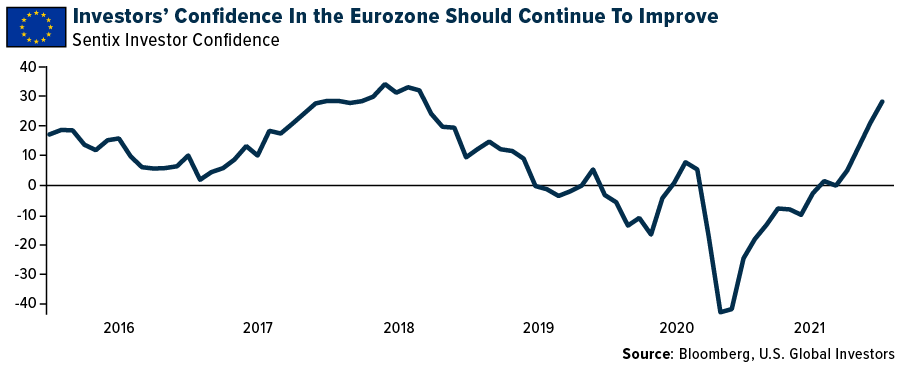
- Confidence in the Eurozone improved to the highest level in more than two decades in June as a reopening of shops, restaurants and other services propelled the region’s recovery from the pandemic crisis. The European Commission said that its economic sentiment indicator increased to 117.9 in June, exceeding almost all estimates in a Bloomberg survey. Investors’ confidence will likely continue to improve in Europe with a better pandemic situation.
- Turkey had it first initial public offering (IPO) listed on Nasdaq this week. Hepsiburada.com is Turkey’s largest online shopping platform, valued at $3.9 billion. Raised funds from the sale of shares will be used for additional offers such as booking flights and money transfers. Hepsiburada.com more than doubled its revenue during last year’s pandemic lockdowns.
- In an interview with French daily La Provence, European Central Bank (ECB) President Lagarde said that the Eurozone’s economy is beginning to rebound from a pandemic-induced slump, but its recovery is fragile. The ECB expects inflation in the medium term to stabilize below its objective. This year the bank predicts inflation to be at 2% and next year prices should slow to 1.5% and 1.4% in 2023.
Threats
- Jaipur Golden, a respected hospital in Delhi, ran out of medical oxygen, the New York Times reported this week. India is a major producer of compressed oxygen, but in this instance, the Indian government moved too late to distribute supplies. Poor emerging market nations with bureaucratic rules and governments that are not run well, are some of the worst during the pandemic. The World Economic Forum says the best countries prepared for health emergencies are the Unites States, United Kingdom, and the Netherlands. Emerging markets have struggled to control the pandemic.
- Chinese stocks slumped the most in four months this week. Investors started selling Chinese shares a day after China ended the Communist Party ‘s 100th anniversary celebration (unsure if the government will continue to provide stability in the market as it did up to the centennial). With the sell-off on Friday, the Shanghai Shenzhen CSI 300 Index closed just below its 200-day moving average, Bloomberg reported. Many investors who trade on technical signals would point out that further weakness will follow.
- The more contentious Delta variant of the coronavirus is spreading across Europe. The United Kingdom is recording an increased number of cases and hospital admissions are rising sharply. Scotland reported the biggest daily increase in cases since the start of the pandemic. On July 2, Russia registered a record number of daily COVID-19 related deaths. The government’s coronavirus taskforce said 679 people have died on Friday, the highest figure confirmed in a single day since the pandemic began. Russia is reporting record high new cases.

Energy and Natural Resources Market
Strengths
- The best performing commodity for the week was corn, up 11.31%. Corn futures surged after the U.S. Department of Agriculture reported much lower-than-expected land estimates, and as weather concerns intensified.
- Electricity prices in Australia are being pushed down as an increase in solar and wind power is reducing the profitability of fossil fuel generation. Electricity generated by wind overtook natural gas power generation for the first time in 2020 and, combined with solar, it cut wholesale prices to their lowest level since 2015, according to the Australian Energy Regulator. It also added that a record 2.5 gigawatts of rooftop solar power entered the National Electricity Market (NEM). Around 27% of buildings in Australia reported to have solar panel systems on their roofs by the end of 2020, the highest proportion in the world, which contributed to a record 3,662 instances of negative prices in the NEM. Wholesale power prices in the NEM fell by 23% to 58% from 2019, with annual price slipping below $52 a megawatt-hour for the first time since 2015.
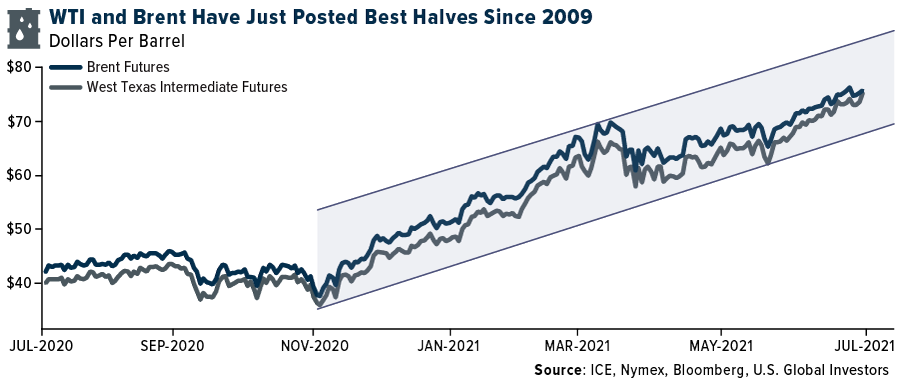
- Oil is headed for its sixth straight week of gains as infighting amongst members of the Organization of Petroleum Exporting Countries and its alliances (OPEC+) has delayed its decision on boosting output, while demand is continuously outstripping supply. West Texas Intermediate (WTI) crude rose 1.40% this week while Brent crude was up 0.98%. The disagreement among OPEC+ members center around how the group measures its production cuts, with United Arab Emirates refusing to agree to a deal to raise output unless the baseline of its own curbs is increased. Crude stockpiles in the U.S. have been declining for the past six weeks, and over the last four weeks the rate of decline has reached 1.15 million barrels a day marking the largest monthly decline on a rolling basis since 1982. WTI and Brent crude had their best performing six months since 2009, rising 51% and 45% respectively.
Weaknesses
- The worst performing commodity for the week was coffee, down 3.01%. Brokers and analysts estimate that most of Brazil’s coffee areas have been spared from frost damage, and exports have increased from Brazil and Honduras on a year-over-year basis.
- Industrial metals mostly traded unchanged or a little lower this week as investors get wary about demand in China and the risk that interest-rate hikes could dampen the pace of economic growth in the U.S. and beyond. Manufacturing and consumption data from China suggests that the country’s economic growth might have peaked while flow of credit tightens. A Bloomberg Intelligence report stated that the slow profit growth of Chinese industries could mean that risks from surging commodity prices might be too great to ignore. The International Monetary Fund (IMF) stated that the U.S. central bank will need to begin raising rates in late 2022 or early 2023 as inflation could remain above its long-run average target. Both copper and nickel are trading lower this week on the London Metal Exchange (LME), down 1.03% and 1.64% respectively, and iron ore on the Dalian Commodity Exchange (DCE) is down 0.30% this week.
- Global shipments of liquefied natural gas (LNG) in June fell from the previous month to about 30.5 million tons as total shipments from top suppliers, Qatar, Australia, and the U.S., declined 9.4% due to maintenance and production issues. This marked as the lowest amount of LNG exported since February, worsening the supply side of a market that is already tight. Drop in LNG supply means nations in Europe will struggle to rebuild inventories drained by previous winters, sending spot prices of the fuel to an all-time high this week. Countries in Asia are raising their bids to attract shipments to the region as they anticipate a hot summer, while Brazil’s worst drought in a century pushed the country’s LNG imports to record highs last month.
Opportunities
- Partners Group Holding AG, a Switzerland-based private equity firm, announced that it bought a majority stake in U.S. community solar developer Dimension Renewable Energy with an investment of $400 million. The firm believes that Dimension’s niche market of U.S. community solar projects could increase its capacity from a current 3 gigawatts to 30 gigawatts in the next five years, enough to power over 20 million average U.S. homes. Dimension provides electricity to local businesses and homes that sign up for the service, especially in low-income communities, and its customers get a credit on their electricity bill. Its projects, that take between 20 and 30 acres, have an average capacity of 5 megawatts, and it currently has about 1.6 gigawatts of projects in development.
- General Motors Co. (GM) is set to invest in Controlled Thermal Resources’ (CTR) project in Imperial, California, which will provide the automotive giant easy access to lithium. The company said that the metal is crucial in making cheaper and higher-mileage electric vehicles, and the CTR project will extract lithium using renewable geothermal energy, with production expected to start in 2024. The CTR project is one of the biggest known lithium brine resources in North America, and the partnership will bring lower-cost lithium to GM as it progresses with plans to build 30 different models of electric vehicles by 2025 and becomes carbon neutral by 2040.
- Scientists at Saudi Arabia’s King Abdullah University of Science and Technology are testing a technique to cool and freeze carbon dioxide captured when fossil fuels are combusted to produce electricity. After converting the gas into a solid or “dry ice,” it can be stored underground or used to make chemicals and other products. This process was developed by Sustainable Energy Solutions, a private company based in Salt Lake City. The current technology captures around 1 ton of carbon dioxide, which scientists hope to increase to 25 tons a day within two years. The project, to deploy at a power plant, is expected to cost $25 million, and if successful, the plan is to create a unit capable of capturing about 1,000 tons a day.
Threats
- Germany and France reported the highest electricity prices for the month of June in about 20 years. This increase can be attributed to soaring costs of natural gas, coal, and carbon, which made electricity generation at thermal plants expensive, and wind output in Germany declined by 33% from a year earlier, further increasing the nation to rely on costlier fossil-fuel power. Prices of July power on the Epex Spot are already trading higher for both countries, with German July power up 14.76% from its June average and the French equivalent rising 14.08%.
- Effects of climate change are at the forefront this summer as states across the Northwest and Northeast of U.S. face record high temperatures. This is taking a toll on infrastructure of states with buckling highways, hobbling public transit, and triggering rolling power outages. Avista Corp., a utilities provider that serves almost 340,000 customers in eastern Washington, Idaho, and Oregon, decided to institute rolling outages for the first time in company’s history. Consolidated Edison Inc. warned 270,000 customers in parts of Queens and Manhattan to conserve energy and encouraged users to not use energy-intensive appliances, noting that it had to reduce voltage levels by 5% to protect its equipment. The average price for day-ahead on-peak power in New England rose 13% this week to the highest levels for this time of the year since 2008, while New York City’s prices jumped by 20% to the highest seasonal level since 2012.
- Rio Tinto Group, the second largest metals and mining corporation in the world, declared force majeure on customer contracts at Richard Bay Minerals (RBM), its South African subsidiary, after it suspended operations due to escalating violence. Managing Director at RBM, which exports titanium dioxide slag used to create ingredients for paints, plastics, sunscreen and even toothpaste, said that the company needs to prioritize safety of its 5,000 employees. Mining operations in South Africa are consistently vexed by community protests relating to issues of poor municipal services and labor conditions, with the latest violence being attributed to youth unemployment. Similar situation occurred in 2019 when RBM was forced to shut operations due to violence, with work subsequently halted on a $463 million expansion project. This latest suspension of operations deals a blow to South Africa’s efforts to attract new investment in the country.

Domestic Economy and Equities
Strengths
- June’s consumer confidence came in at 127.3 versus consensus 119.0 and May’s upwardly revised 120.0 level. It is the highest headline level since February 2020.
- The final reading for the manufacturing PMI remained unchanged in June at a record high level of 62.1, but slightly lower than the earlier released "flash" estimate of 62.6. Relaxation of COVID-19 restrictions encouraged the demand growth from new and existing customers.
- Advanced Micro Devices, a semiconductor producer, was the best performing S&P 500 stock for the week, increasing 10.6%. The company’s pending acquisition of fellow chipmaker Xilinx in a $35 billion transaction has been cleared this week under antitrust laws by the European Commission.
Weaknesses
- U.S. construction spending fell 0.3% in May. The Commerce Department reported Thursday that the May decline followed a slight 0.1% rise in April and left overall construction spending up 7.5% from a year ago.
- An unemployment rate of 5.9% was reported above the consensus of 5.6% and prior to the reading of 5.8%. Thus far, the U.S. has recovered 15.6 million, or 70%, of the 22.4 million jobs lost since last spring, leaving the nation 6.8 million jobs below its pre-pandemic level.
- Walgreens Boots Alliance Inc., a retail drugstore, was the worst performing S&P 500 stock for the week, losing 7.7%. Shares declined after the company reported disappointing third quarter results on Thursday.
Opportunities
- United States consumers are optimistic about business conditions over the next six months, with 33.3% expecting improvement and only 10.6% forecasting worse conditions (down from 14.4% in May).
- The Congressional Budget Office (CBO) latest update to the budget and economic outlook said economic growth for this year will be stronger than previously estimated, with GDP rising 7.4% this year, up from the 3.7% forecast from February. The CBO also sees consumer prices rising by 3.4% this year, then falling back toward 2% for the rest of the decade. A comprehensive 10-year outlook may be published in late July, as well as other documents analyzing President Biden’s economic plans.
- Initial filings for unemployment insurance fell sharply last week, indicating continued improvement in the U.S. jobs market, the Labor Department reported Thursday. Initial jobless claims fell to 364,000 from 411,000, below estimated 388,000. Enhanced benefit programs at the federal level expire in September, and many states already have halted their own programs as employment continues to improve.
Threats
- Treasury Secretary Yellen said on Thursday that a group of 130 countries agreed to a global minimum tax on corporate profits. The minimum tax is part of a broader global tax overhaul that includes taxing multinationals in countries where they make money. Goldman Sachs has said that such a policy would have a small aggregate impact on S&P 500 earnings. Estimated that absent from other tax reforms, a 15% global minimum tax rate would represent downside of 1%-2% relative to current consensus S&P 500 2022 earning per share estimates.
- The Congressional Budget Office (CBO) latest update to the budget and economic outlook showed expectations for the federal budget deficit to total $3 trillion in 2021, up $745 billion from the February estimate with federal debt reaching 103% of GDP. In February, the CBO projected a $2.26 trillion deficit for fiscal 2021, which ends on Sept. 30, but that figure did not factor in the impact of President Joe Biden’s $1.9 trillion pandemic aid package enacted in March.
- U.S. markets continue to move higher. S&P 500 index finished the week at fresh record high, gaining 16.7% year to date and 41.2% in one year. However, some analysts warn about stretched valuations, saying peak earnings and peak policy themes also fit into the more cautious narrative.

Blockchain and Digital Currencies
Strengths
- Of the cryptocurrencies tracked by CoinMarketCap, the best performer for the week was XinFin Network, rising 93.22%.
- Mercado Bitcoin, the largest cryptocurrency exchange in Brazil, announced that it finished its Series B financing round, raising $200 million from the SoftBank Latin America Fund. The deal is the largest Series B round in Latin America’s history, and gives the company a $2.1 billion valuation. 2TM Group, the parent company of Mercado Bitcoin, reported that the company plans to further expand its operations in Latin American nations and is contemplating adding branches in Argentina, Chile, Colombia, and Mexico. Mercado Bitcoin added 700,000 new users between January and May 2021, boasting a total client base of 2.8 million, and saw its trading volume balloon to $5 billion, which surpassed the total for its first seven years of operations combined.
- Ukraine’s parliament, Verkhovna Rada, passed a law that considers the country’s potential central bank digital currency (CBDC) to be like cash or a bank account. The law describes the electronic Ukrainian hryvnia, which has not been launched yet, being on par with cash, bank accounts, and electronic payments, and as a unit of account in Ukraine. The National Bank of Ukraine (NBU) launched its efforts to create a CBDC in 2018 and has a prototype on the Stellar Blockchain, but progress has been stalled since it published a report on the advantages and disadvantages of a CBDC in September 2019.
Weaknesses
- Of the cryptocurrencies tracked by CoinMarketCap, the worst performer for the week was Quant, down 22.65%.
- Customer complaints against major U.S. cryptocurrency exchanges have increased over the past year as cryptocurrencies became more popular. The Consumer Financial Protection Bureau (CFPB) reported that of the top three crypto exchanges operating in the U.S., Coinbase received the most complaints during the past year, with concerns about domestic and international money transfers, digital wallets, and foreign currency exchange. Customers registered around 1,060 complaints against Coinbase, while complaints against companies Binance.US and Kraken stood at 184 and 34, respectively.
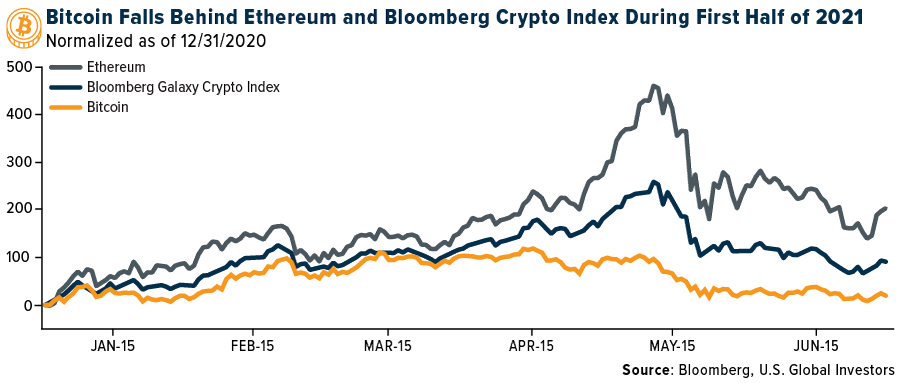
- Bitcoin posted its worst second quarter (Q2) performance since 2018 as the world’s largest cryptocurrency tumbled more than 40% during the period, down more than 45% from its mid-April high of $68,863. Bitcoin’s previous two Q2 returns, for 2019 and 2020, were 157% and 42%. On average, since 2014, Bitcoin has registered a return of 33.95% and has never registered a Q2 return lower than 6%. This decline came from the wide-spread scrutiny of the environmental impact of mining the cryptocurrency and the Chinese government’s crackdown on mining operations in the country. The chart below shows that Bitcoin’s performance has lagged that of Ethereum and the Bloomberg Galaxy Crypto Index during the first half of 2021.
Opportunities
- Germany’s Fund Allocation Act, which was introduced in April 2021 and passed by the parliament, is set to come into effect this week and could theoretically prompt up to $415 billion to flow into cryptocurrencies. The act allows “Spezialfonds”, or special funds, to invest as much as 20% of their assets under management (AUM) into cryptocurrencies. Spezialfonds are one of the most dominant investment vehicles in Germany, and allocation of such size could have a positive impact on the crypto ecosystem in Europe.
- JPMorgan reported that the upcoming launch of Ethereum 2.0 network will make staking coins for yield an attractive source of income for both institutional and retail investors, as the update shifts the blockchain from a proof-of-work (PoW) to a proof-of-stake (PoS) consensus mechanism. The report added that an estimated $9 billion is being earned by holders of staked coins on PoS blockchains, annually, and that as Ethereum transitions to PoS by next year, the annual revenue could increase to $20 billion.
- The Bitcoin Mining Council (BMC) released a report stating that the global Bitcoin mining sector has reached an estimated 56% sustainable power mix in second quarter of 2021. This estimate was derived from just 32% of the miners on Bitcoin’s network who are currently utilizing electricity with a 67% sustainable power mix. The BMC classifies sustainable electricity as hydro, solar, wind, nuclear, geothermal, and carbon-based generation with net carbon credits, based on the principles from the International Energy Agency’s (IEA) Net Zero by 2050 report. BMC’s report comes at a time when Chinese miners are either shutting down operations or are flocking to cheap-energy hubs like Quebec in Canada and Kazakhstan.
Threats
- Cryptocurrency trading platforms in India might have to pay an additional 18% tax even if they are not domiciled in the country. Currently, all exchanges which operate in India and are based outside the country do not pay the goods and services tax (GST), and the country’s tax authority is examining whether such levy should be applied to crypto exchanges, which the department would categorize as providing an online information database access and retrieval (OIDAR) service. Further, cryptocurrency exchanges in India have been struggling to find financial institutions that will offer services to their business as the regulatory environment around digital assets remains unclear in the country.
- Fitch Ratings Inc. released a report stating that stablecoins, which are digital tokens pegged to government-issued currencies like the U.S. dollar, could pose contagion risks over time. Analysts and economists have been speculating that if Tether suffers financial losses or there is a dip in consumer confidence, it could trigger a sell-off which can put downward pressure on prices of other cryptocurrencies. Fitch noted that such an event could also have implications for traditional markets, as Tether, which has total assets amounting to $62.8 billion, holds 49.6% of its assets in commercial paper (CP), which can be illiquid, and can create a wider selling pressure in the CP market.
- Binance, the biggest cryptocurrency exchange in the world, is under scrutiny once again as Thailand’s Securities and Exchange Commission (SEC) filed a criminal complaint against the exchange for allegedly operating within the country without relevant licenses. The complaint, filed with the Economic Crime Suppression Division of the Royal Thai Police (ECD), states that Binance failed to meet a deadline for responding to an earlier warning. The SEC added that the exchange solicited Thai customers to use its services via its website or the “Binance Thai Community” page on Facebook. Binance has also received a warning over similar matters from regulators in Japan, been prohibited from operating in the U.K. and exited the Ontario market following regulatory actions against other exchanges in the Canadian province.
Gold Market
This week spot gold closed the week at $1,787.30, up $5.60 per ounce, or 0.33%. Gold stocks, as measured by the NYSE Arca Gold Miners Index, ended the week lower by 0.16%. The S&P/TSX Venture Index came in up 2.10%. The U.S. Trade-Weighted Dollar rose 0.43%.
| Date | Event | Survey | Actual | Prior |
|---|---|---|---|---|
| Jun-28 | Hong Kong Exports YoY | 23.6% | 24.0% | 24.4% |
| Jun-29 | Germany CPI YoY | 2.4% | 2.3% | 2.5% |
| Jun-29 | Conf. Board Consumer Confidence | 119.0 | 127.3 | 120.0 |
| Jun-30 | Eurozone CPI Core YoY | 0.9% | 0.9% | 1.0% |
| Jun-30 | ADP Employment Change | 600k | 692k | 978k |
| Jun-30 | Caixin China PMI Mfg | 51.9 | 51.3 | 52.0 |
| Jul-1 | Initial Jobless Claims | 388k | 364K | 415k |
| Jul-1 | ISM Manufacturing | 60.9 | — | 1.0% |
| Jul-2 | Change in Nonfarm Payrolls | 720k | 850k | 583k |
| Jul-2 | Durable Goods Orders | 2.3% | 2.3% | 2.3% |
| Jul-6 | Germany ZEW Survey Expectations | 75.0 | — | 79.8 |
| Jul-6 | Germany ZEW Current Situation | 5.0 | — | -9.1 |
| Jul-8 | Initial Jobless Claims | 350k | — | 364k |
Strengths
- The best performing precious metal for the week was palladium, up 5.67% on strong industrial demand and ongoing supply disruptions. TD Securities wrote that it expects palladium to be a positive catalyst for platinum group metals (PGMs) continuing into 2022. Sandstorm Gold Ltd. raised its production outlook following the performance of a gold stream and royalty agreement, and the purchase of a royalty package on a piece of Vale S.A.’s operations. With the addition of the royalties, Sandstorm is forecasting attributable gold equivalent production between 62,000 to 69,000 ounces in 2021. In addition, Maverix has acquired a portfolio of six royalties from Pan American Silver in exchange for 491,071 common shares of Maverix and a cash payment of $7,000,000. Royal Gold has entered a gold streaming deal on Ero Copper’s NX Gold Mine in Brazil. Royal Gold will make a $100 million payment in return for 25% of the gold produced from the NX Gold Mine until the delivery of 93,000 ounces, and 10% thereafter. Royal Gold will pay 20% of the spot gold price for each ounce delivered until the delivery of 49,000 ounces, and 40% of the spot gold price thereafter.
- Prime Mining reported initial drill results from the Mina 20/21 area, 1.3 kilometers northeast of Guadalupe East, at its Los Reyes project. The headline result of 4.4 grams per ton silver and 1,060 grams per ton silver provides an early indication that the company may have discovered an additional underground deposit.
- The ratio of the S&P 500 to gold is nearing a 15-year high, implying that gold is cheap. The reason why this ratio is moving adversely, is due to improving economic fundamentals. However, recent economic data points have been worse than high expectations, implying that this ratio could be close to peaking.
Weaknesses
- The worst performing precious metal for the week was platinum, down 1.53% despite the positive TD Securities report. Gold has been hammered by a growing list of headwinds from the Federal Reserve, signaling it is preparing to slow stimulus to rising risk appetite. Prices are set for their worst month since November 2016 after U.S. central bank officials pulled forward their forecasts for interest rate hikes. Also, the dollar is strengthening due to concerns about the delta virus strain of COVID-19 outside of the U.S.
- Golden Star Resources Ltd. on Monday slashed its 2021 production guidance after flagging a delay in the commissioning process for the new paste fill plant at its Wassa gold mine in Ghana. The company now expects gold production in the range of 145,000 to 155,000 ounces at an all-in sustaining cost of U.S. $1,150 to U.S. $1,250 per ounce. This compares with the initial target of 165,000 ounces to 175,000 ounces at U.S. $1,000 to U.S. $1,075 per ounce.

- Gold continues to be sold by ETFs, with the Thursday trading sessions witnessing their largest redemptions for the week. On a year-to-date basis, gold ETFs have reduced their holdings by nearly 6%. Gold bounced back to positive territory for the week with the nonfarm payrolls number adding more jobs than expected but unemployment still edged up, implying the Federal Reserve can wait longer, perhaps.
Opportunities
- Karora Resources on Monday said it expects to nearly double its gold production over the next three years on an expansion of its Beta Hunt mine in Australia. The company plans to produce around 195,000 ounces of gold in 2024, up from its expected output of about 110,000 ounces this year. Karora said the increase will come as it raises the output of its Beta Hunt underground operations to 2 million tons annually from 0.8 million tons and expands its Higginsville mill.
- Aya Gold & Silver Inc. said that it has been granted seven new exploration permits in Morocco. The Canadian miner said the permits were granted by the country’s Ministry of Energy, Mines and Environment, and would increase its position within its Zgounder Regional and Azegour area properties by about 40%. There are also showings of copper mineralization on the ground controlled by Aya, which need to be followed up on.
- Silver Tiger reported high-grade assays from drilling, stepping out 900 meters south along the Sooy vein. The company is ramping up to 5 drills on the property to accelerate work on the extensive, high-grade system.
Threats
- Gold Road reported that it expects second quarter production (100% basis, GOR 50%) to be lower at 52,000 to 55,000 ounces (a 24% drop) due to disruptions in the processing plant relating to a torn mill feed conveyor belt and failed ball mill coupling. Additionally, maintenance costs are expected to be higher as well.
- The relationship of B2Gold with the Malian government could be strained. B2Gold announces the commencement of international arbitration proceedings, regarding the refusal of the Menankoto exploration permit. This comes after the denial of the expected permit renewal in March of this year, to which the company believes it is entitled to a further one-year extension under the 2012 Malian Mining Code.
- Jake Lloyd-Smith, writing for Bloomberg, writes “gold is about to lose more of its shine.” Federal Reserve watching is likely to get more attention as we head into the next two Fed meetings in July and September. If investors start to believe the focus on tapering to be more eminent, yields could be bid up and lead to a stronger dollar.

Leaders and Laggards
U.S. Global Investors, Inc. is an investment adviser registered with the Securities and Exchange Commission ("SEC"). This does not mean that we are sponsored, recommended, or approved by the SEC, or that our abilities or qualifications in any respect have been passed upon by the SEC or any officer of the SEC.
This commentary should not be considered a solicitation or offering of any investment product. Certain materials in this commentary may contain dated information. The information provided was current at the time of publication. Some links above may be directed to third-party websites. U.S. Global Investors does not endorse all information supplied by these websites and is not responsible for their content. All opinions expressed and data provided are subject to change without notice. Some of these opinions may not be appropriate to every investor.
Holdings may change daily. Holdings are reported as of the most recent quarter-end. The following securities mentioned in the article were held by one or more accounts managed by U.S. Global Investors as of (03/31/2021):
Aya Gold & Silver Inc.
B2Gold Corp.
Golden Star Resources Ltd.
Karora Resources Inc.
Maverix Metals Inc.
Pan American Silver Corp.
Prime Mining Corp.
Royal Gold Inc.
Sandstorm Gold Ltd.
Southwest Airlines Co.
United Airlines Holdings Inc.
Tesla Inc.
Wizz Air Holdings Plc.
*The above-mentioned indices are not total returns. These returns reflect simple appreciation only and do not reflect dividend reinvestment.
The Dow Jones Industrial Average is a price-weighted average of 30 blue chip stocks that are generally leaders in their industry. The S&P 500 Stock Index is a widely recognized capitalization-weighted index of 500 common stock prices in U.S. companies. The Nasdaq Composite Index is a capitalization-weighted index of all Nasdaq National Market and SmallCap stocks. The Russell 2000 Index® is a U.S. equity index measuring the performance of the 2,000 smallest companies in the Russell 3000®, a widely recognized small-cap index.
The Hang Seng Composite Index is a market capitalization-weighted index that comprises the top 200 companies listed on Stock Exchange of Hong Kong, based on average market cap for the 12 months. The Taiwan Stock Exchange Index is a capitalization-weighted index of all listed common shares traded on the Taiwan Stock Exchange. The Korea Stock Price Index is a capitalization-weighted index of all common shares and preferred shares on the Korean Stock Exchanges.
The Philadelphia Stock Exchange Gold and Silver Index (XAU) is a capitalization-weighted index that includes the leading companies involved in the mining of gold and silver. The U.S. Trade Weighted Dollar Index provides a general indication of the international value of the U.S. dollar. The S&P/TSX Canadian Gold Capped Sector Index is a modified capitalization-weighted index, whose equity weights are capped 25 percent and index constituents are derived from a subset stock pool of S&P/TSX Composite Index stocks. The NYSE Arca Gold Miners Index is a modified market capitalization weighted index comprised of publicly traded companies involved primarily in the mining for gold and silver. The S&P/TSX Venture Composite Index is a broad market indicator for the Canadian venture capital market. The index is market capitalization weighted and, at its inception, included 531 companies. A quarterly revision process is used to remove companies that comprise less than 0.05% of the weight of the index, and add companies whose weight, when included, will be greater than 0.05% of the index.
The S&P 500 Energy Index is a capitalization-weighted index that tracks the companies in the energy sector as a subset of the S&P 500. The S&P 500 Materials Index is a capitalization-weighted index that tracks the companies in the material sector as a subset of the S&P 500. The S&P 500 Financials Index is a capitalization-weighted index. The index was developed with a base level of 10 for the 1941-43 base period. The S&P 500 Industrials Index is a Materials Index is a capitalization-weighted index that tracks the companies in the industrial sector as a subset of the S&P 500. The S&P 500 Consumer Discretionary Index is a capitalization-weighted index that tracks the companies in the consumer discretionary sector as a subset of the S&P 500. The S&P 500 Information Technology Index is a capitalization-weighted index that tracks the companies in the information technology sector as a subset of the S&P 500. The S&P 500 Consumer Staples Index is a Materials Index is a capitalization-weighted index that tracks the companies in the consumer staples sector as a subset of the S&P 500. The S&P 500 Utilities Index is a capitalization-weighted index that tracks the companies in the utilities sector as a subset of the S&P 500. The S&P 500 Healthcare Index is a capitalization-weighted index that tracks the companies in the healthcare sector as a subset of the S&P 500. The S&P 500 Telecom Index is a Materials Index is a capitalization-weighted index that tracks the companies in the telecom sector as a subset of the S&P 500.
The Consumer Price Index (CPI) is one of the most widely recognized price measures for tracking the price of a market basket of goods and services purchased by individuals. The weights of components are based on consumer spending patterns. The Purchasing Manager’s Index is an indicator of the economic health of the manufacturing sector. The PMI index is based on five major indicators: new orders, inventory levels, production, supplier deliveries and the employment environment. Gross domestic product (GDP) is the monetary value of all the finished goods and services produced within a country’s borders in a specific period, though GDP is usually calculated on an annual basis. It includes all of private and public consumption, government outlays, investments and exports less imports that occur within a defined territory.
Bloomberg Dollar Spot Index (BBDXY) tracks the performance of basket of 10 leading global currencies versus the U.S. Dollar. It has a vigorously updated composition and represents a distinct set of currencies that are important from a trade and liquidity perspective.
The CSI 300 Index is a free-float weighted index that consists of 300 A-share stocks listed on the Shanghai or Shenzhen Stock Exchanges
An assay (in the mining industry) is a process of analyzing a substance to determine its composition or quality.
Standard deviation is a measure of the dispersion of a set of data from its mean. The more spread apart the data, the higher the deviation. Standard deviation is also known as historical volatility.
