


Gold and Commodities Set to Soar in 2019
Date Posted: January 11, 2019
Read time: 49 min
Palladium was the best performing commodity for the second year in a row, returning 18.59 percent in 2018 after ending the previous year up a phenomenal 56.25 percent.
By Frank Holmes
CEO and Chief Investment Officer
U.S. Global Investors
Summary:
- An update to the Periodic Table of Commodity Returns.
- Goldman Sachs issues an overweight recommendation for gold and commodities.
- Paradigm Capital says royalty companies are the “best bet” in metals and mining.
Our ever-popular Periodic Table of Commodity Returns has been updated for 2018 and is now available on the U.S. Global Investors website! I invite you to get lost using the interactive feature, which easily allows you to highlight a certain commodity, the top performer, the most volatile and more.

Palladium was the best performing commodity for the second year in a row, returning 18.59 percent in 2018 after ending the previous year up a phenomenal 56.25 percent. As we’ve noted before in the Investor Alert and elsewhere, palladium and gold prices are now near parity, with a razor-thin spread of only around $2 separating the two at the moment. Late last year, the white metal actually overtook the yellow metal for the first time since 2001 on increased demand from automobile manufacturers. More than 80 percent of world supply is used in the production of catalytic converters.
Not to be outdone, gold ended 2018 on a high note, beating global equities and commodities for the fourth quarter. And as I mentioned last week, it was the sixth most liquid asset class, with daily trading volumes nearly identical to that of S&P 500 companies.
Goldman Bullish on Gold, Forecasts $1,425
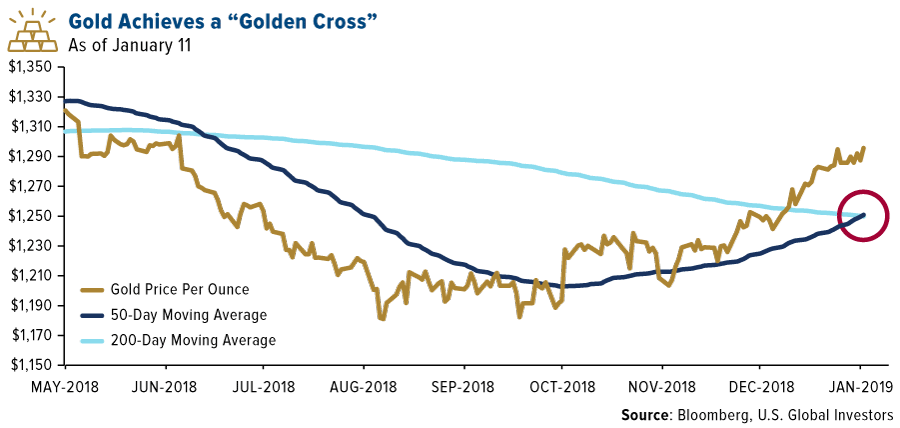
With a majority of investors now betting that the current rate hike cycle has peaked, the U.S. dollar looks to be in retreat, having lost about 1.7 percent over the past month. Mike McGlone, commodity strategist at Bloomberg Intelligence, writes that he believes the “2019 dollar downtrend has legs.” This is constructive for metals and commodities in general, gold specifically. Today, in fact, the yellow metal achieved a “golden cross,” whereby the 50-day moving average crosses above the 200-day moving average—a very bullish sign.
Among those that are most bullish on the precious metal is Goldman Sachs. In a report this week, the investment bank maintained its overweight recommendation and raised its 12-month price forecast up from $1,350 an ounce to $1,425, a level last seen in August 2013. Goldman analysts contend that the gold price “will be supported primarily by growing demand for defensive assets, with a slower pace of Fed rate hikes in 2019 boosting demand only marginally.”
The World Gold Council (WGC) made a similar case in its 2019 outlook this week, predicting that global investors will “continue to favor gold as an effective diversifier and hedge against systemic risk.” The rise in protectionist policies around the world is chief among the risks since they tend to lead to higher inflation and slower economic growth over the long term, according to the WGC.
I believe the current government shutdown, over funding for a wall along the southern border, is evidence of the risks protectionist policies pose. Soon to be the longest in U.S. history, the shutdown could start to take a toll on the economy the longer it lasts, according to Federal Reserve Chair Jerome Powell, and perhaps even cost the U.S. its triple-A credit rating.
Commodities Could Also Be a Buy Right Now
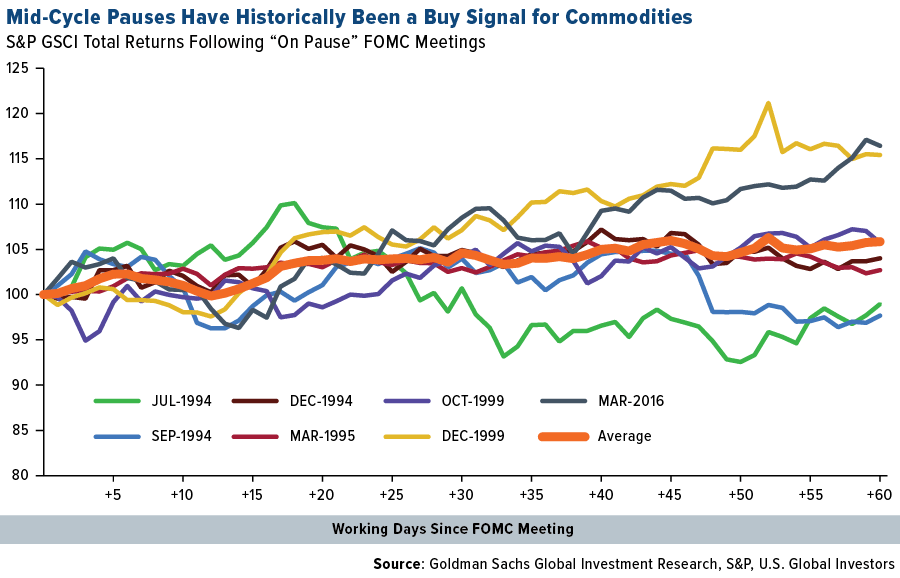
Goldman Sachs isn’t just bullish on gold. Commodities also look like a strong buy, the bank’s analysts say, after prices were slashed late last year. Before the fourth quarter, commodities were following the “late-cycle playbook.” Up 16 percent, they were the best performing asset class of 2018. But with the Fed now “on hold” and there being “low risk” of a recession, Goldman says it can now argue “with confidence” that the sell-off last year was a “mid-cycle pause.”
This is actually good news for commodities, as mid-cycle pauses have historically been a buying opportunity. Look at the chart below. It shows that, with few exceptions, commodity prices rallied in the days and weeks following a “pause” signal from the Federal Open Market Committee (FOMC). And as you might already know, Powell recently commented that the Fed “can afford to be patient” and “flexible” when it comes to additional rate hikes.
Goldman maintains an overweight recommendation for commodities, with a 12-month forecast of 9.5 percent.
Gold Royalty Companies Are the “Best Bet,” Says Paradigm Capital
It’s no secret that I’m a fan of royalty and streaming companies. (You can read my posts featuring Franco-Nevada and Wheaton Precious Metals.) I’ve long admired these companies for generating profits and creating value, even when the metals market is flat or weak.
This week, Paradigm Capital reaffirmed my conviction in the royalty model. The Canadian investment dealer shared its research into the long-term performance of the various tiers in gold mining, from juniors to seniors, from explorers to developers. The royalty companies—which include not just Franco and Wheaton but also Royal Gold, Sandstorm and Osisko Royalties—are the “best bet” when seeking to “make money in gold equities,” according to Paradigm’s senior analyst, Don MacLean. He adds: “Royalty companies have the best business model in the sector, by far.”
Below, you can see that royalty companies have outperformed all other tiers, including gold itself. They collectively delivered 16 percent in compound annual growth from 2004 to 2018. Put another way, they returned a massive 884 percent in cumulative change, compared to gold at 300 percent.

Many junior and senior producers have struggled over the same time period, but Paradigm writes that gold equities are like “coiled springs” and should outperform the precious metal if a “meaningful” gold rally of 10 percent or more occurs. Right now large-cap seniors are leading the rally, having increased 24 percent over the past three months, followed by intermediates (up 18 percent) and royalty companies (up 15 percent). This is in line with past gold equity rallies, Paradigm says, as the largest producers have historically performed best at the start.
My focus lately has been on how the idea of “peak gold” might drive the need for mergers and acquisitions (M&As) within the metals and mining industry. It’s been almost a decade since the last round of deals, and because there’s a sore lack of big discoveries right now to replenish reserves, I feel as if we’re due for more M&A activity this year. The Barrick Gold-Randgold merger, announced last September, might have been just the start of a new wave of consolidation.
In case you missed it, our very own Ralph Aldis, precious metals expert and portfolio manager, shared his top stock pick for 2019 with MoneyShow. To find out which one it is, click here!

Gold Market
This week spot gold closed at $1,287.76 up $2.61 per ounce, or 0.20 percent. Gold stocks, as measured by the NYSE Arca Gold Miners Index, ended the week lower by 1.12 percent. The S&P/TSX Venture Index came in up 2.44 percent. The U.S. Trade-Weighted Dollar fell 0.53 percent.
| Date | Event | Survey | Actual | Prior |
|---|---|---|---|---|
| Jan-10 | Initial Jobless Claims | 226k | 246k | 233k |
| Jan-11 | CPI YoY | 1.9% | 1.9% | 2.2% |
| Jan-14-18 | New Homes Sales | 567k | — | 544k |
| Jan-14-18 | Durable Goods Orders | — | — | 0.8% |
| Jan-15 | PPI Final Demand YoY | 2.5% | — | 2.5% |
| Jan-16 | Germany CPI YoY | 1.7% | — | 1.7% |
| Jan-17 | Eurozone CPI Core YoY | 1.0% | — | 1.0% |
| Jan-17 | Housing Starts | 1253k | — | 1256k |
| Jan-17 | Initial Jobless Claims | 223k | — | 216k |
Strengths
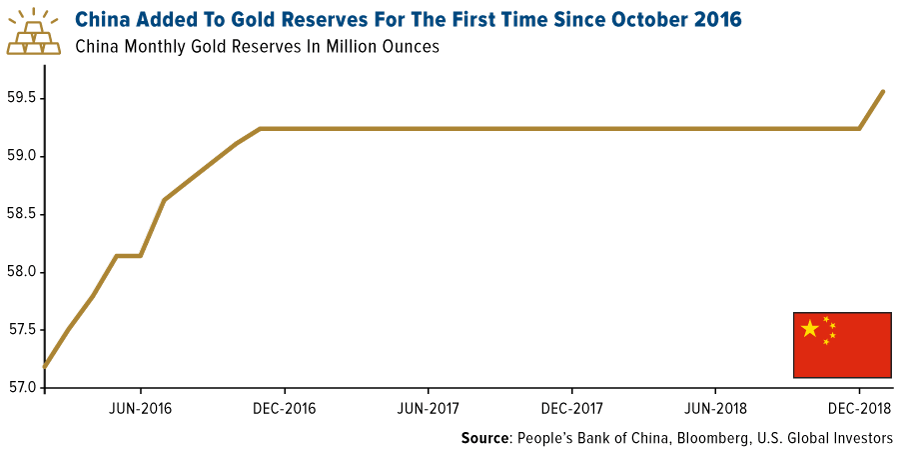
- The best performing metal this week was palladium, up 1.71 percent, and now the most expensive precious metal. Gold, meanwhile, is set for its fourth weekly gain, marking its longest rally since October. Traders surveyed by Bloomberg are bullish on the yellow metal for a ninth straight week. In December, China added to its gold reserves for the first time since October 2016, according to the People’s Bank of China. Reserves now total 59.56 million ounces, or $76.331 billion. China – the world’s top producer of gold – adding to its reserves is a bullish sign for the precious metal.
- ETFs backed by gold saw 10 straight days of inflows, adding 37,174 troy ounces on Thursday alone. This year’s net purchases so far are 762,975 troy ounces, according to data compiled by Bloomberg. The price of gold finished 110 rupees higher on Wednesday due to increased wedding season buying by jewelers to meet seasonal demand.
- Ascot Resources announced this week that it will be acquiring IDM Mining to create a gold development and exploration company. The merger will consolidate Ascot’s Premiere Gold project and IDM’s Red Mountain project in northwestern British Colombia’s Golden Triangle. Tanzanian President John Magufuli directed its central bank to buy some of the nation’s gold produced for its reserves saying that “we should get to a point where we are reserving our gold, because gold is similar to money.”
Weaknesses
- The worst performing metal this week was silver, down 0.64 percent on no particular news but it is noteworthy that ETFs that invest physical silver, unlike gold, have seen their holdings drop. According to Bloomberg data, investments in ETFs that focus on commodities fell by 66 percent this week. However, gold ETFs still saw positive inflows, with the iShares Gold Trust seeing a big inflow of $175 million. Gold imports in India have dropped 23 percent in December, with imports totaling 762 tons in 2018, versus 951 tons the year prior. High domestic prices for gold have deterred buyers in the world’s second largest consuming country, as the falling rupee makes it more expensive to purchase the yellow metal.
- BullionVault’s gold index, measuring the number of buyers against sellers, fell to 51.8 in December, the lowest reading since August 2017, reports Bloomberg. However, any reading above 50 indicates that there are more buyers than sellers in the market. The Perth Mint reported that gold coin and minted bar sales dropped to a six-month low in December to just 29,186 ounces sold. Annual gold sales were still up 9 percent year-over-year.
- The core consumer price index, measuring inflation, rose 2.2 percent from a year earlier for a second month and increased 0.2 percent from November, reports Bloomberg. Fed Vice Chairman Richard Clarida said in a speech this week that “inflation has surprised to the downside recently” and that it is unclear if inflation has moved back to the central bank’s target. U.S. Mint data showed this week that U.S. gold coin sales were down in December to the lowest level in three years.
Opportunities
- BlackRock Inc. portfolio manager Russ Koesterich is bullish on gold and said in an interview this week that “we’re constructive on gold”, as the group has been raising bullion holdings since the third quarter of last year through ETFs. He continued to say that “we think it’s going to be a valuable portfolio hedge” and “what we see value in right now is gold’s value as a diversifier.”
- Goldman Sachs continues to be bullish on commodities in 2019 even as oil prices fell in the fourth quarter and led to a selloff. Bloomberg reports that the bank has also raised its 12-month price forecast for gold to $1,425 an ounce, up from $1,350. Analysts including Jeff Currie wrote in a note this week that “a mid-cycle pause is a buy signal for commodities.”
- Palladium finished 2018 strong and UBS analysts continue to be bullish on the most expensive precious metal. Palladium forwards eased more than 700 basis points since Monday, which might provide a buying opportunity, however both Jaguar and Ford announced layoffs this week indicating some weakness in the sector. UBS writes that palladium is in a multi-year deficit with demand growing and supply remaining contained. Joni Teves says that “the long-trend upward journey is intact” for palladium prices.
Threats
- Bloomberg writes that bond demand is falling drastically. The bid-to-cover ratio is at its lowest point since 2009 and that of the $2.4 trillion of notes and bonds the Treasury issued last year, investors submitted bids for just 2.6 times that amount, according to Bloomberg data. Torsten Slok, chief international economist at Deutsche Bank, writes that “all fiscal crises begin with a declining bid-to-cover ratio.”
- Due to the ongoing trade war with China and U.S. government shutdown, economists surveyed by Bloomberg put the risk of a U.S. recession at the highest in more than six years. The survey this week showed a median 25 percent chance of a slump in the next 12 months, which is up from 20 percent in last month’s survey.
- President of the Federal Reserve Bank of St. Louis, James Bullard, said he is concerned that more interest rate increases could push the economy into a recession, writes Bloomberg’s Brendan Murray. Bullard said in an interview with the Wall Street Journal that the Fed is “bordering on going too far and possibly tipping the economy into recession.”

Index Summary
- The major market indices finished up this week. The Dow Jones Industrial Average gained 2.40 percent. The S&P 500 Stock Index rose 2.54 percent, while the Nasdaq Composite climbed 3.45 percent. The Russell 2000 small capitalization index gained 4.83 percent this week.
- The Hang Seng Composite gained 4.02 percent this week; while Taiwan was also up 4.02 percent and the KOSPI rose 3.25 percent.
- The 10-year Treasury bond yield rose 2 basis points to 2.70 percent.
Domestic Equity Market
Strengths
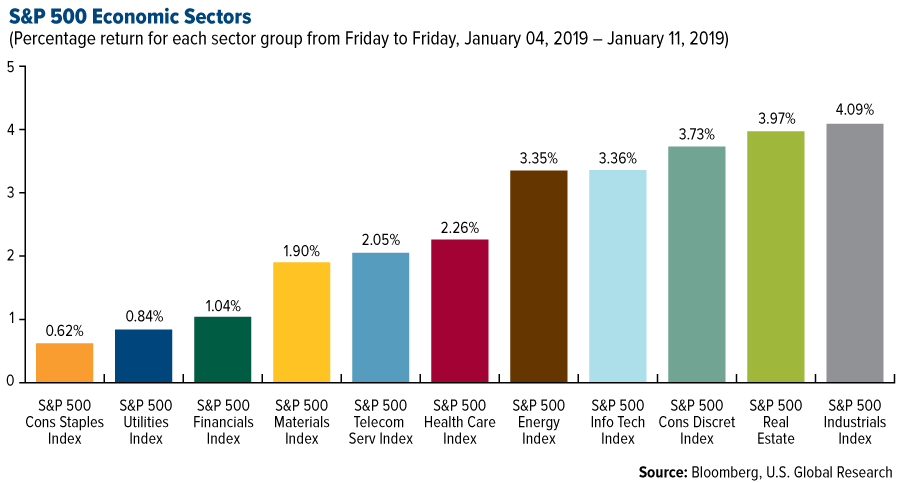
- Industrials was the best performing sector of the week, decreasing by 4.09 percent versus an overall increase of 2.52 percent for the S&P 500.
- Nektar Therapeutics was the best performing stock for the week, increasing 20.76 percent.
- Amazon is now the world’s most valuable company, ending Microsoft’s rein at the top for five weeks. The online retail giant experienced a strong holiday sales period, bringing its market capitalization to $802 billion and edging past Microsoft’s roughly $795 billion valuation.
Weaknesses
- Consumer staples was the worst performing sector for the week, increasing by 0.62 percent versus an overall increase of 2.52 percent for the S&P 500.
- PG&E Corp was the worst performing stock for the week, falling 27.91 percent.
- Samsung says its profit decline is due to weaker Chinese demand. The company’s quarterly profit fell 29 percent, marking the first drop in two years, as a slowing Chinese economy led to weaker demand, Reuters reports.
Opportunities
- Citi says "buy this latest dip." The bank says that its "Bear Market Checklist" shows only 3.5 of its 18 factors are flashing a sell signal and that it will become more worried "when 7-8 factors are flagging caution."
- Goldman Sachs published a list of stocks that it believes are most undervalued and will likely surge higher because of solid earnings. The list includes: American Airlines, Albemarle, Aptiv, Tiffany & Co., Noble Energy, Alliance Data Systems, Tapestry, Freeport-McMoRan, Netflix, Alexion Pharmaceuticals, Nektar Therapeutics, DXC Technology and PG&E.
- Marc Benioff wants to double Salesforce sales by 2022. The Salesforce CEO told CNBC that he’s targeting $20 billion of sales by 2022, up from $10.48 billion in 2018.
Threats
- Morgan Stanley has forecast a rough 2019 for companies that make the chips in the world’s smartphones and servers. The investment bank warned in a note published last week that semiconductor companies could suffer a "sharp contraction" in revenue.
- The major surge in debt issuance by U.S. corporations through highly levered buyouts and low-interest-rate acquisitions could be a major part of the next financial crisis, according to the research firm CLSA. Excess leverage suggests that markets could be set for a "Minsky Moment," or a sudden and major collapse in asset valuations. The theory goes that stability begets instability, namely that investors take more risks when things appear to be safe and steady, thus sowing the seeds of their own demise. As such, rising leverage can be seen as a conduit to greater financial market instability.
- "Strategically, we recommend investors increase portfolio defensiveness," a team of Goldman Sachs strategists led by David Kostin told clients Monday. "Cash allocations are at or near the bottom of their 30-year historical distribution for many investors."
The Economy and Bond Market
Strengths
- The Federal Reserve can “afford to be patient” on future interest rate hikes. Minutes from the December Federal Open Market Committee (FOMC) meeting released Wednesday reiterate the central bank’s claim that it is not on a preset rate path. This flexibility was well received by investors who fear a policy mistake by the Fed.
- The number of Americans filing jobless benefits applications fell more than expected last week, pointing to sustained labor market strength that could further ease concerns about the economy’s health. Initial claims for state unemployment benefits fell 17,000 to a seasonally adjusted 216,000 for the week ended January 5.
- U.S. consumer prices in December fell for the first time in nine months amid a plunge in fuel costs, but underlying inflation pressures remained firm as rental housing and health care costs rose steadily. The Labor Department said on Friday its consumer price index (CPI) dipped 0.1 percent last month, the first drop and weakest reading since March. The CPI was unchanged in November. In the 12 months through December, the CPI rose 1.9 percent.
Weaknesses
- Because of the ongoing partial government shutdown, the U.S. economy has lost an estimated $3.6 billion, according to an analysis by Standard & Poor’s Global Ratings. It will only take another two weeks for the shutdown to cost the economy $5.7 billion, the same amount that the White House has requested for President Donald Trump’s southern border wall. The shutdown on Friday tied for the longest in U.S. history at 21 days. If the shutdown continues, the per-week impact will balloon beyond the roughly $1.2 billion that have been lost each week since it began, S&P found.
- The U.S. services sector expanded at a slower-than-expected pace in December, according to data released Monday. The Institute for Supply Management (ISM) said its non-manufacturing index came in at 57.6 last month. Economists polled by Refinitiv expected the ISM non-manufacturing index to slip to 59 in December. A reading above 50 reflects expansion.
- The National Federation of Independent Business (NFIB) found that small business owners’ confidence in the U.S. economy fell for the fourth consecutive month and that their outlook on business conditions fell to the lowest level since late 2016. The small business lobby said its optimism index fell from November’s 104.8 reading to 104.4 in December.
Opportunities
- Next week’s housing data is forecast to reflect a pickup at the end of the year. This would be a welcome sign for investors as the slowdown in housing has been a major area of worry for the U.S. economy.
- Investors will be watching next Wednesday’s release of U.S. retail sales. Retail sales have been on a decent run in 2018—they’ve been in positive territory for nine months in a row. With wage growth at 10-year highs and U.S. retailers offering attractive discounts during the holiday season, we could see another strong month. A positive number would round off what was a strong year for the U.S. jobs market and wage growth.
- In a Thursday morning statement, China’s Commerce Ministry said the just-concluded round of trade talks with the U.S. were extensive and established a foundation for the resolution of each other’s concerns. Both parties, the Beijing ministry said, agreed to maintain close contact. Additionally, U.S. officials expect China’s top trade negotiator to visit Washington this month, signaling that higher-level discussions are likely to follow this week’s talks with mid-level officials in Beijing.
Threats
- Fitch warns that the U.S.’s triple-A rating is in jeopardy. "If this shutdown continues to March 1 and the debt ceiling becomes a problem several months later, we may need to start thinking about the policy framework, the inability to pass a budget, and whether all of that is consistent with triple-A," Fitch’s global head of sovereign ratings, James McCormack, said Wednesday.
- The year could be off to a troubling start as analysts cut profit forecasts for global companies by the most since 2009, according to Citi’s Earnings Revision Index. Concerns about the slowdown in economic growth and the U.S.-China trade war are making analysts feel cautious about corporate earnings prospects.

- The U.S. is likely to lose its crown as the world’s most powerful economy next year. China is forecast to become the world’s strongest economy in 2020, when measured by a combination of purchasing power parity (PPP), exchange rates and nominal GDP. What’s more, the Asian giant is unlikely to ever relinquish its spot, according to the bank Standard Chartered.
Energy and Natural Resources Market
Strengths
- Oil was the best performing commodity, rising 7.74 percent for the week. The commodity was set to post its biggest weekly gain in two years as OPEC cuts and a potential U.S.-China trade deal bolstered bullish sentiment. The Saudi-led OPEC coalition pledged to keep global oil markets in balance, even if it required further output cuts.
- The best performing sector for the week was the S&P 1500 Paper & Forest Products Index. The index rose 10.65 percent, rebounding from a deep oversold condition after homebuilder executives quoted better than expected volumes in the fourth quarter as a result of lower U.S. 10-year rates.
- The best performing major natural resource stock for the week was Resolute Forest Products Inc. The Canadian paper producer rose 13.78 percent mainly on sector related tailwinds.
Weaknesses
- Soy was the worst performing commodity for the week. The commodity dropped 1.13 percent after the U.S.-China trade talks ended without any specific commitments for China to purchase U.S. grains.
- The worst performing sector this week was the S&P/TSX Gold Index. The index dropped 2.59 percent as the broader stock market rebounded on favorable risk-on sentiment resulting from advances in the China-U.S. trade talks.
- The worst performing stock for the period was Barrick Gold Corp. The Canadian major gold producer dropped 5.75 percent tracking lower gold prices, in addition to reports that Tanzania appointed a new minerals minister which previously led a parliamentary investigation against the mining industry. Barrick’s exposure to Tanzania is through a 64-percent stake in Acacia Mining.
Opportunities
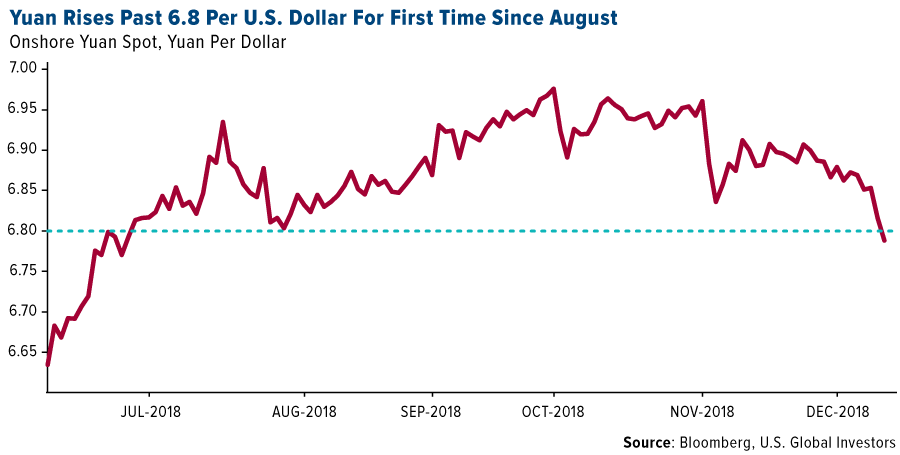
- The Chinese yuan rebounded to five-month highs as trade talks boost confidence. The Chinese currency rose past 6.8 amid optimism a trade dispute with the U.S. is nearing an end. The U.S. and China ended three days of mid-level negotiations in Beijing on Wednesday, laying the foundation for a resolution to the trade conflict. A stronger Chinese yuan has positive correlation with commodity imports into the Asian nation.
- Copper and aluminum are the top metals picks for 2019, according to UBS. If the trade war eases, sentiment should improve at a time when inventories are low, premiums are supportive and Chinese infrastructure stimulus is expected to lift post-winter demand, stated the note.
- China approved new agricultural imports from the U.S. this week, the first time in about 18 months. The approval, which applies to five genetically modified crops could boost China’s grain imports and ease pressure for the U.S. to open its market to more farm goods. The U.S. is the world’s biggest producer of genetically modified crops.
Threats
- China posted a sharp deceleration in price indicators for the month of December. Producer Price Index (PPI) rose a mere 0.9 percent in December, while Consumer Price Inflation posted a 1.9 percent rise, both amply missing forecasts. The sharp deceleration rekindles fears of a return of the specter that ravaged corporate profits from 2012 to 2016, according to Nomura.
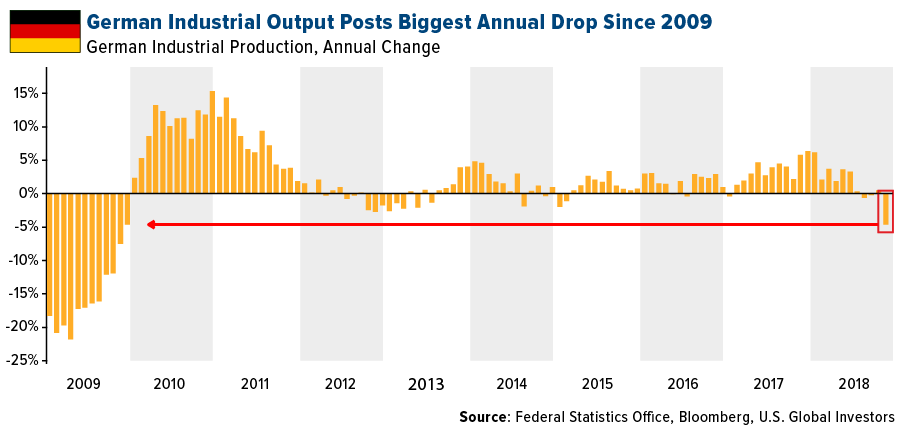
- Germany’s industrial output posted an unexpected drop in December. For the third straight month, German industrial output contracted, underscoring concerns about a slowdown. German factories churned out fewer intermediate, capital and consumer goods, according to data from the Economic Ministry.
- New data suggests a shocking slowdown in shale activity. Despite lower breakeven costs, recent data suggests the U.S. shale industry slowed dramatically in the fourth quarter of 2018 in response to the plunge in oil prices. According to the Federal Reserve Bank of Dallas, business activity in the sector plunged dramatically, from a reading of 43.3 in the third quarter to a meager 2.3 growth in the fourth quarter.

Emerging Europe
Strengths
- Greece was the best performing country this week, gaining 3.25 percent. The country posted a current-account surplus for a fourth straight month, which was impacted by currency depreciation last year and aggressive monetary tightening. Turkey’s inflation is expected to decline to 15.9 percent in the next 12 months, down from the current 20.3 percent.
- The Russian ruble was the best relative performing currency this week, gaining 92 basis points against the U.S. dollar. The Russian currency was supported by stronger oil prices. Brent crude oil gained 6.1 percent in the past five days. The Central Bank of Russia will begin buying foreign currencies again on January 15.
- Communication service was the best performing sector among eastern European markets this week.
Weaknesses
- Romania was the worst performing country this week, losing 5.5 percent. Equities trading on the Bucharest exchange have been volatile since the government announced its plan to tax banks, utilities and telecommunication companies in order to address a budget deficit. If the plan is implemented in its original form, it will bring 3.6 billion lei next year to the budget. The measure, however, hurts investor confidence, and foreign investors own most Romanian banks.
- The Turkish lira was the worst performing currency this week, losing 2.5 percent against the U.S. dollar. U.S.-Turkey tensions spiked after the U.S. announced that it would not withdraw its troops from northern Syria if the safety of Kurds was in jeopardy. Moreover, Turkey will not drop its purchase of the S-400 missile defense system from Russia, in favor of buying U.S. defense system.
- Utilities was the worst performing sector among eastern European markets this week.
Opportunities
- According to ECB minutes published on Thursday, the bank has doubts about the strength of the recovery in the Eurozone. Recently released data has been weaker than expected, and the previously planned rate hikes in second half of 2019 could be postponed. The ECB’s bond buying program ended at the end of 2018, and going forward the central bank’s policy will depend on economic data. However, the ECB is still confident that rising wages will eventually boost inflation.
- Hungary plans to announce stimulus measures to counter the impacts from the global slowdown and keep its economy growing at 4 percent. Steps may include further subsidies for families and will be published in the first three months of the year. Investors fear slower growth this year due to global trade disruptions and rising interest rates, but Hungary remains supportive of its economic growth, says Prime Minister Viktor Orban.
- Signs of an end to gold’s almost 10 percent rally since August is good news for emerging market stocks. The traditional negative relationship between the two assets, which broke down in 2017, has returned. Investors may be moving away from safe heaven assets, such as gold, and into more risky assets, such as equites of emerging markets.
Threats
- The parliament in the U.K. will vote on a Brexit withdraw deal next Tuesday. Prime Minister Theresa May had delayed the vote on the deal agreed to by 27 members of the eurozone before Christmas in order to seek further assurance over the Northern Ireland border. Her opposition is asking her to call a general election if Parliament does not approve the Brexit deal.
- Germany, Europe’s largest economy, saw its industrial output unexpectedly fall in November, putting the economy at risk of slipping into a technical recession at the end of 2018. The decline was broad-based and led by consumer goods and energy. French and Italian industrial production also fell unexpectedly in November.
- Ford will cut thousands of jobs in Europe and may close production plants as aging models and Brexit tensions put pressure on the company’s revenue. Ford employs 54,000 people in Germany, Spain and the U.K.
China Region
Strengths
- It was a strong week for the region, with Singapore’s Straits Times Total Return Index jumping 4.56 percent while fellow developed market Hong Kong’s Hang Seng Composite climbed 4.02 percent.
- Energy was the top performing sector in the Hang Seng Composite, jumping 6.23 percent over the last five trading days.
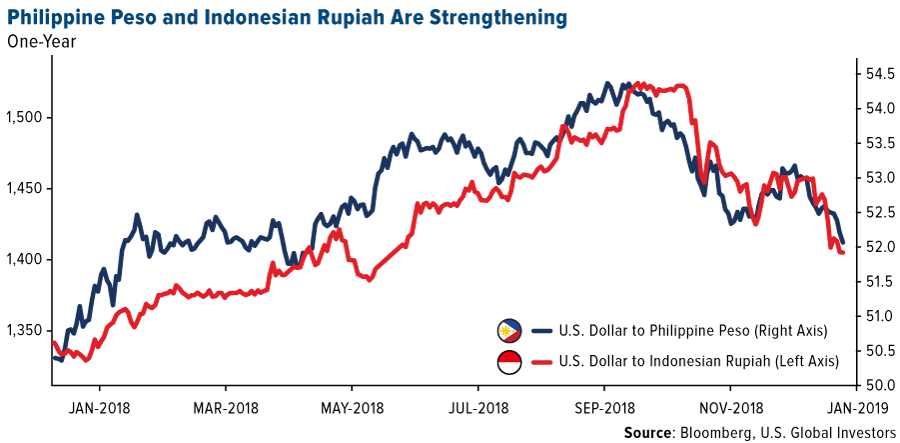
- The Philippine peso and the Indonesian rupiah have both continued to strengthen of late, helped by a weaker U.S. dollar and a slightly more dovish tone from the U.S. Federal Reserve. The strengthening in these countries’ respective currencies has also vivified their respective equity markets as well as foreign flows.
Weaknesses
- In a green week for the region, Malaysia’s Kuala Lumpur Composite jumped a mere 82 basis points, while India’s SENSEX and NIFTY indices also climbed less than one percent.
- All sectors closed up in the green amid the Hang Seng Composite Index for the risk-on week, with even the laggard utilities sector jumping 2.73 percent.
- China lowered its GDP growth forecast for 2019 down to a range of 6.0-6.5 percent, Bloomberg News reported on Friday.
Opportunities
- Top-level trade talks between Chinese Vice Premier Liu He and U.S. Trade Representative Robert Lighthizer and Treasury Secretary Mnuchin, are now reportedly set for the end of the month, various media sources suggest. This is progress. And with the Chinese having lowered the GDP growth outlook to the 6-6.5 percent range, perhaps the heat is on, which may mean some or at least partial resolution of the trade war.
- The Chinese yuan strengthened 1.6 percent against the U.S. dollar over the past week, which could possibly help provide more cover for the Chinese in negotiations with the United States over trade.
- The China Banking and Insurance Regulatory Commission announced that China will continue to open up its more than $40 trillion financial sector this year, Bloomberg News reported on Friday, signaling, the article continues, that policy makers want to continue to open up the system regardless of the outcome of the trade war with the United States or the outcome of trade talks. Last month’s approval of UBS Group AG’s application to take majority control of its local securities venture, demonstrates that changes are indeed taking place, the authors of the article observes.
Threats
- The resumption of the trade war apace remains a looming threat on the near- to medium-term horizon. This is not necessarily expected, but if either side digs in and/or escalates, the market would likely dislike this outcome and most certainly dislikes any uncertainty said outcome creates or introduces.
- A continued rise in energy prices could weigh on major importing countries in the region; Indonesia and India remain particularly sensitive to oil prices.
- The World Bank lowered its overall forecast for global growth this year to 2.9 percent, down from 2018’s 3.0 percent. The World Bank slashed its China forecast to 6.2 percent, down from 6.3.
Blockchain and Digital Currencies
Strengths
- Of the cryptocurrencies tracked by CoinMarketCap, the best performing for the week ended January 11 was CariNet, up 933.51 percent.
- Bitwise Asset Management, a cryptocurrency index fund provider, applied to launch a new bitcoin-backed exchange-traded fund (ETF) on Thursday with the Securities and Exchange Commission (SEC), reports MarketWatch. This ETF differs from the company’s first filing in July 2018, the article continues, in that it would require third-party custodians to hold the physical bitcoins.
- Twelve months after suffering a $530 million hack, Japanese crypto exchange Coincheck, is now a licensed entity, reports Coindesk. Japan-based online brokerage firm Monex Group, which acquired Coincheck for $33.5 million after the hack, announced Friday that the exchange is now registered with the Kanto Financial Bureau. The registration is under the country’s Payment Service Act and effective immediately.
Weaknesses
- Of the cryptocurrencies tracked by CoinMarketCap, the worst performing for the week ended January 11 was Tokugawa, down 84.39 percent.
- According to a recent research report, hackers have mined an estimated 4.32 percent of the total Monero (XMR) in circulation, reports Coindesk. It is the most popular cryptocurrency among criminals deploying mining malware, the study reads. The one question that has gone unanswered by the study, however, is what portion of malware owners have actually cashed out their cryptocurrency.
- Bloomberg reports that cryptocurrencies dropped on Thursday, with bitcoin failing to hold the $4,000 level that it has hovered around since the beginning of 2019. In European morning trading, the largest digital currency fell as much as 6.2 percent. In addition, Ethereum Classic came under a “so-called 51 percent attack, in which some computers supporting the network falsify transactions,” the article continues.

Opportunities
- The Ethereum Foundation announced Monday that it will grant $5 million to support Parity Technologies’ work on building the blockchain network’s next iteration, Ethereum 2.0, reports Coindesk. The grant, which will be provided in several phases, is focused on “scalability, usability and security,” with a focus on boosting Casper, a proof-of-stake protocol upgrade, the article continues.
- Although rejecting two applications, Thailand’s Ministry of Finance announced Tuesday that it has granted digital asset business licenses to at least four cryptocurrency firms, reports Coindesk. According to the country’s Securities and Exchange Commission, out of the four firms receiving the licenses, three are crypto exchanges and one is a crypto broker-dealer.
- On Friday Ethereum development studio ConsenSys announced that it is participating in a $2 million seed funding round for Iceland-based blockchain startup Monerium, reports Coindesk. Monerium is a financial technology firm “developing a solution for transacting fiat currencies over blockchains, what it calls ‘e-money’,” the article reads. The seed funding will go toward the acceleration of developing its services.
Threats
- Beam, a newly released privacy-oriented cryptocurrency, announced on Wednesday that a “critical vulnerability” has been discovered in its wallet software, writes Coindesk. Luckily, the announcement clarified that the vulnerability found in the software was discovered solely by the Beam development team. Beam Wallet users were urged to uninstall the application immediately and re-download a patched version again from its website, according to the official Twitter account.
- Privacy-focused bitcoin wallet Samourai, who released version 0.99.04 of its app Tuesday on the digital distribution service run by Google, known as Google Play, is being forced to remove some of its security features. As Samourai explained in a blog post, it has removed a series of key security-related features as a result of “extremely restrictive policies” by Google, reports Coindesk. The three removed features include stealth mode, SIM switch defense and remote SMS commands.
- The wife of a wealthy Norwegian businessman has been kidnapped, with demands being made for a hefty random to be paid in cryptocurrency, reports the New York Times. On October 31, Anne-Elisabeth Falkevik Hagen, age 68, went missing from her home where a ransom note was left behind demanding large quantities of Monero, which is an unregulated digital currency known for anonymous transactions, the article continues. This headline brings to light the illegal and criminal use of cryptocurrencies as well as calls to regulate, or even ban, their use.

Leaders and Laggards
| Index | Close | Weekly Change($) |
Weekly Change(%) |
|---|---|---|---|
| S&P/TSX Global Gold Index | 179.31 | -4.04 | -2.20% |
| Gold Futures | 1,288.60 | +2.80 | +0.22% |
| Natural Gas Futures | 3.15 | +0.11 | +3.48% |
| S&P/TSX VENTURE COMP IDX | 601.77 | +14.33 | +2.44% |
| 10-Yr Treasury Bond | 2.70 | +0.03 | +1.05% |
| Nasdaq | 6,971.48 | +232.62 | +3.45% |
| Oil Futures | 51.67 | +3.71 | +7.74% |
| Hang Seng Composite Index | 3,536.85 | +136.79 | +4.02% |
| S&P 500 | 2,596.26 | +64.32 | +2.54% |
| DJIA | 23,995.95 | +562.79 | +2.40% |
| Korean KOSPI Index | 2,075.57 | +65.32 | +3.25% |
| Russell 2000 | 1,447.39 | +66.64 | +4.83% |
| S&P Energy | 458.28 | +14.87 | +3.35% |
| S&P Basic Materials | 327.44 | +6.09 | +1.90% |
| XAU | 71.71 | -0.16 | -0.22% |
| Index | Close | Monthly Change($) |
Monthly Change(%) |
|---|---|---|---|
| Natural Gas Futures | 3.15 | -0.99 | -23.84% |
| S&P/TSX Global Gold Index | 179.31 | +1.28 | +0.72% |
| 10-Yr Treasury Bond | 2.70 | -0.21 | -7.32% |
| Oil Futures | 51.67 | +0.52 | +1.02% |
| Gold Futures | 1,288.60 | +38.60 | +3.09% |
| S&P 500 | 2,596.26 | -54.81 | -2.07% |
| S&P Energy | 458.28 | -7.09 | -1.52% |
| Hang Seng Composite Index | 3,536.85 | +21.51 | +0.61% |
| DJIA | 23,995.95 | -531.32 | -2.17% |
| Korean KOSPI Index | 2,075.57 | -7.00 | -0.34% |
| Nasdaq | 6,971.48 | -126.84 | -1.79% |
| S&P Basic Materials | 327.44 | +1.23 | +0.38% |
| Russell 2000 | 1,447.39 | -7.94 | -0.55% |
| S&P/TSX VENTURE COMP IDX | 601.77 | +39.53 | +7.03% |
| XAU | 71.71 | +3.07 | +4.47% |
| Index | Close | Quarterly Change($) |
Quarterly Change(%) |
|---|---|---|---|
| Natural Gas Futures | 3.15 | -0.07 | -2.23% |
| 10-Yr Treasury Bond | 2.70 | -0.45 | -14.41% |
| DJIA | 23,995.95 | -1,056.88 | -4.22% |
| Oil Futures | 51.67 | -19.30 | -27.19% |
| S&P 500 | 2,596.26 | -132.11 | -4.84% |
| Gold Futures | 1,288.60 | +55.00 | +4.46% |
| S&P Energy | 458.28 | -80.59 | -14.96% |
| Nasdaq | 6,971.48 | -357.59 | -4.88% |
| Korean KOSPI Index | 2,075.57 | -54.10 | -2.54% |
| S&P Basic Materials | 327.44 | -8.62 | -2.57% |
| Russell 2000 | 1,447.39 | -98.00 | -6.34% |
| Hang Seng Composite Index | 3,536.85 | +149.96 | +4.43% |
| S&P/TSX Global Gold Index | 179.31 | +9.31 | +5.48% |
| S&P/TSX VENTURE COMP IDX | 601.77 | -89.69 | -12.97% |
| XAU | 71.71 | +1.74 | +2.49% |
U.S. Global Investors, Inc. is an investment adviser registered with the Securities and Exchange Commission ("SEC"). This does not mean that we are sponsored, recommended, or approved by the SEC, or that our abilities or qualifications in any respect have been passed upon by the SEC or any officer of the SEC.
This commentary should not be considered a solicitation or offering of any investment product.
Certain materials in this commentary may contain dated information. The information provided was current at the time of publication.
Some links above may be directed to third-party websites. U.S. Global Investors does not endorse all information supplied by these websites and is not responsible for their content.
Holdings may change daily. Holdings are reported as of the most recent quarter-end. The following securities mentioned in the article were held by one or more accounts managed by U.S. Global Investors as of (09/30/2018):
Resolute Forest Products Inc.
Acacia Mining PLC
IDM Mining Ltd
Franco-Nevada Corp
Wheaton Precious Metals Corp
Royal Gold Inc
Sandstorm Gold Ltd
Osisko Gold Royalties Ltd
American Airlines Group Inc
Freeport-McMoRan Inc
DXC Technology Co
*The above-mentioned indices are not total returns. These returns reflect simple appreciation only and do not reflect dividend reinvestment.
The Dow Jones Industrial Average is a price-weighted average of 30 blue chip stocks that are generally leaders in their industry. The S&P 500 Stock Index is a widely recognized capitalization-weighted index of 500 common stock prices in U.S. companies.
The Nasdaq Composite Index is a capitalization-weighted index of all Nasdaq National Market and SmallCap stocks.
The Russell 2000 Index is a U.S. equity index measuring the performance of the 2,000 smallest companies in the Russell 3000, a widely recognized small-cap index.
The Hang Seng Composite Index is a market capitalization-weighted index that comprises the top 200 companies listed on Stock Exchange of Hong Kong, based on average market cap for the 12 months.
The Taiwan Stock Exchange Index is a capitalization-weighted index of all listed common shares traded on the Taiwan Stock Exchange.
The Korea Stock Price Index is a capitalization-weighted index of all common shares and preferred shares on the Korean Stock Exchanges.
The Philadelphia Stock Exchange Gold and Silver Index (XAU) is a capitalization-weighted index that includes the leading companies involved in the mining of gold and silver.
The U.S. Trade Weighted Dollar Index provides a general indication of the international value of the U.S. dollar.
The S&P/TSX Canadian Gold Capped Sector Index is a modified capitalization-weighted index, whose equity weights are capped 25 percent and index constituents are derived from a subset stock pool of S&P/TSX Composite Index stocks.
The S&P 500 Energy Index is a capitalization-weighted index that tracks the companies in the energy sector as a subset of the S&P 500.
The S&P 500 Materials Index is a capitalization-weighted index that tracks the companies in the material sector as a subset of the S&P 500.
The S&P 500 Financials Index is a capitalization-weighted index. The index was developed with a base level of 10 for the 1941-43 base period.
The S&P 500 Industrials Index is a Materials Index is a capitalization-weighted index that tracks the companies in the industrial sector as a subset of the S&P 500.
The S&P 500 Consumer Discretionary Index is a capitalization-weighted index that tracks the companies in the consumer discretionary sector as a subset of the S&P 500.
The S&P 500 Information Technology Index is a capitalization-weighted index that tracks the companies in the information technology sector as a subset of the S&P 500.
The S&P 500 Consumer Staples Index is a Materials Index is a capitalization-weighted index that tracks the companies in the consumer staples sector as a subset of the S&P 500.
The S&P 500 Utilities Index is a capitalization-weighted index that tracks the companies in the utilities sector as a subset of the S&P 500.
The S&P 500 Healthcare Index is a capitalization-weighted index that tracks the companies in the healthcare sector as a subset of the S&P 500.
The S&P 500 Telecom Index is a Materials Index is a capitalization-weighted index that tracks the companies in the telecom sector as a subset of the S&P 500.
The NYSE Arca Gold Miners Index is a modified market capitalization weighted index comprised of publicly traded companies involved primarily in the mining for gold and silver.
The Consumer Price Index (CPI) is one of the most widely recognized price measures for tracking the price of a market basket of goods and services purchased by individuals. The weights of components are based on consumer spending patterns.
The Purchasing Manager’s Index is an indicator of the economic health of the manufacturing sector. The PMI index is based on five major indicators: new orders, inventory levels, production, supplier deliveries and the employment environment.
The S&P/TSX Venture Composite Index is a broad market indicator for the Canadian venture capital market. The index is market capitalization weighted and, at its inception, included 531 companies. A quarterly revision process is used to remove companies that comprise less than 0.05% of the weight of the index, and add companies whose weight, when included, will be greater than 0.05% of the index.
Gross domestic product (GDP) is the monetary value of all the finished goods and services produced within a country’s borders in a specific time period, though GDP is usually calculated on an annual basis. It includes all of private and public consumption, government outlays, investments and exports less imports that occur within a defined territory.
The S&P Supercomposite Paper & Forest Products Index is a capitalization-weighted index. The index was developed with a base value of 100 as of December 30, 1994. The Producer Price Index (PPI) measures prices received by producers at the first commercial sale. The index measures goods at three stages of production: finished, intermediate and crude. The S&P/TSX Composite Gold Sub Industry Index is composed of a subset of the constituents of the S&P/TSX Composite Index that have been classified according to the Global Industry Classification Standard. The index was developed with a base value of 1000 as of 1975. BullionVault’s Gold Investor Index measures the balance of private investors buying gold to start or grow their holding across the month over those reducing or selling them entirely. A reading of 50.0 means the number of people buying gold across the month was perfectly balanced by the number of sellers. The S&P GSCI Total Return Index in USD is widely recognized as the leading measure of general commodity price movements and inflation in the world economy. Index is calculated primarily on a world production weighted basis, comprised of the principal physical commodities futures contracts. The Straits Times Index comprises the top 30 SGX Mainboard listed companies on the Singapore Exchange selected by full market capitalization. The Kuala Lumpur Stock Exchange Composite Index (KLCI) is a broad-based capitalization-weighted index of 100 stocks designed to measure the performance of the Kuala Lumpur Stock Exchange. The S&P BSE SENSEX Index is a free-float market-weighted stock market index of 30 well-established and financially sound companies listed on the Bombay Stock Exchange. Citi’s Earnings Revision Index tracks global net earnings revisions.

