


Is the Fed Done Hiking Rates? Watch the Price of Gold
Date Posted: January 4, 2019
Read time: 52 min
King Dollar was on top in 2018, one of the few major assets to close the year in the black on steady interest rate hikes and robust economic growth in the U.S. But greenback strength is a double-edged sword, as you know. Although good for U.S. consumers, it can hamper exporters, commodities, oil, gold and more.
By Frank Holmes
CEO and Chief Investment Officer
U.S. Global Investors

King Dollar was on top in 2018, one of the few major assets to close the year in the black on steady interest rate hikes and robust economic growth in the U.S. But greenback strength is a double-edged sword, as you know. Although good for U.S. consumers, it can hamper exporters, commodities, oil, gold and more.
So will rates continue to rise in 2019? If so, the dollar will follow suit, putting additional pressure on other assets. I think there are a number of signs that the rate hike we saw in December could be the last one this cycle. Just today, Federal Reserve Chairman Jerome Powell commented that “we will be patient” with further rate hikes, which I believe is good news.
I’ll have more to say on rates in a second.
Under the circumstances, I’m very pleased with how well gold performed last year. It’s doing what it’s supposed to do. Stocks began to sell off late in the year, boosting investor demand for safe haven assets. As I explained in a Frank Talk this week, the yellow metal beat the S&P 500 Index for the month of December, the fourth quarter and the year. It’s also outperforming the market so far in the 21st century.

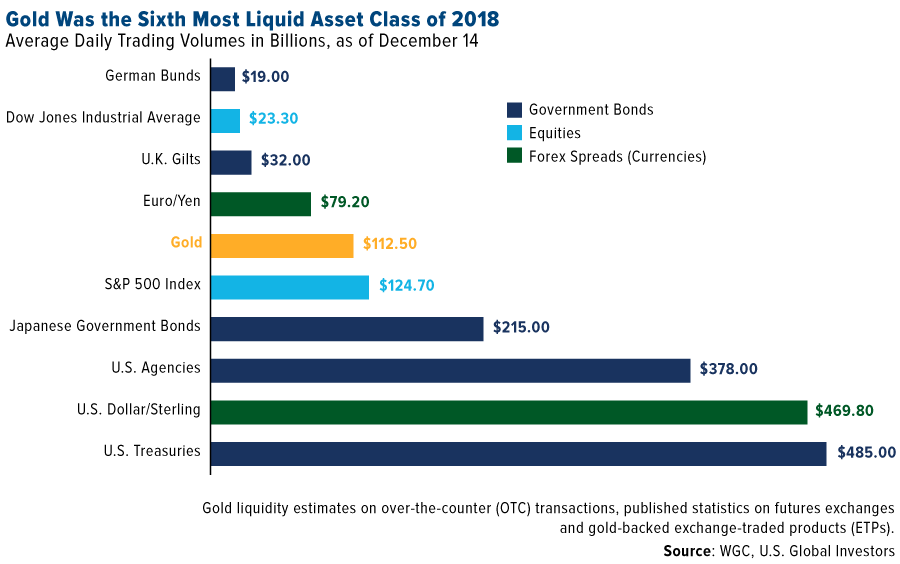
Gold was also one of the most liquid assets of 2018, with daily trading volumes in the same neighborhood as S&P 500 companies, according to the World Gold Council (WGC). I can’t stress enough how important this is, as it underscores the maturity and trustworthiness of the gold market. The WGC puts it well: “Clarity and transparency in financial markets is beneficial to investors as it increases their level of comfort and their understanding of an asset.”
Investors Are Betting That the Fed Hits the Pause Button
Back to interest rate policy. Again, I think Powell’s pledge to “be patient” is good news and shows that he’s willing to listen to those who have very publicly expressed their objection to further rate increases, including investing heavyweights such as Jeffrey Gundlach and Stanley Druckenmiller. Yesterday the Dallas Fed president, Robert Kaplan, said he supported putting additional rate hikes on hold to see how the global economy plays out.
“I would be an advocate of taking no action… in the first couple of quarters this year,” Kaplan told Bloomberg.
Investors seem to agree. Last month, the CME Group’s FedWatch Tool showed an 87 percent probability that the fed funds rate would either stay where it is now or be lowered by the end of 2019. That’s up dramatically from less than 10 percent in October. Meanwhile, bets that the rate would rise in 12 months’ time have dropped to around 12 percent.

In a note to investors this week, Stifel shared its belief that the Fed “has reached historical maximum tightness,” arguing that the central bank must “wait for the neutral rate to rise” before tightening again, or else risk “credit deterioration, recession and a deep bear market.” (The “neutral rate” is not set by the Fed but a reflection of the fed funds rate that “keeps output growing around its potential rate in an environment of full employment and stable inflation,” in the words of Fed Board Governor Lael Brainard.) According to the investment bank, we’re right at the peak of the interest rate cycle, somewhere between phase two (characterized by tightening) and phase three (characterized by cutting rates).

“The Fed has taken restrictive policy to its very limits, and we see further S&P 500 downside if they do not stop tightening for most (or all) of 2019,” writes Stifel strategist Barry Bannister. “There are signs the Fed may stand down and wait for the neutral rate to rise.”
Possible Implication? A Weaker U.S. Dollar
One of the possible implications of a less aggressive Fed in 2019 is a weaker dollar—especially if the European Central Bank (ECB) begins tightening later this year, as some analysts predict. As I’ve explained before, once the dollar starts to lose ground relative to other world currencies, gold could rocket up to as much as $1,500 in the blink of an eye.
Among those that are bearish on the greenback is Citi, which writes in a note this week that the greenback “may more than reverse [2018’s] rally over the medium term.” The bank predicts 12 percent downside versus other major currencies, citing the flattening (and, in one case, already inverted) yield curve as a signal of weaker economic growth.
Mike McGlone, commodity strategist at Bloomberg Intelligence, believes dollar mean reversion will be the theme in 2019, which would favor gold and commodities. “It’s unlikely for 2019 that the dollar will remain atop the list of best-performing assets,” according to McGlone, who adds that “markets appear in the transition phase of passing the bull market baton from U.S. stocks to commodities.”
Manufacturing Expansion Continues to Slow
Besides a strong dollar, the big risk to commodities right now is weaker demand from factories, which is turning up in the purchasing manager’s index (PMI).
The JPMorgan Global Manufacturing PMI fell to a 27-month low of 51.5 in December, down from 52.0 a month earlier. Amazingly, business confidence among global manufacturers dropped to its lowest level in the series history, according to David Hensley, JPMorgan’s director of global economic coordination.
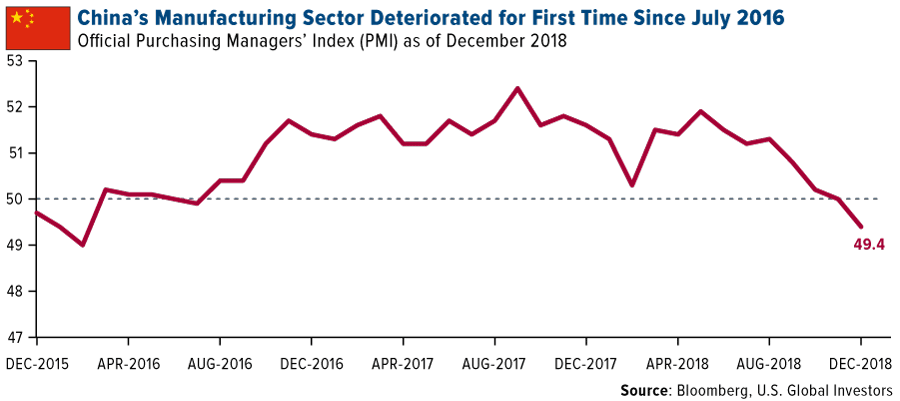
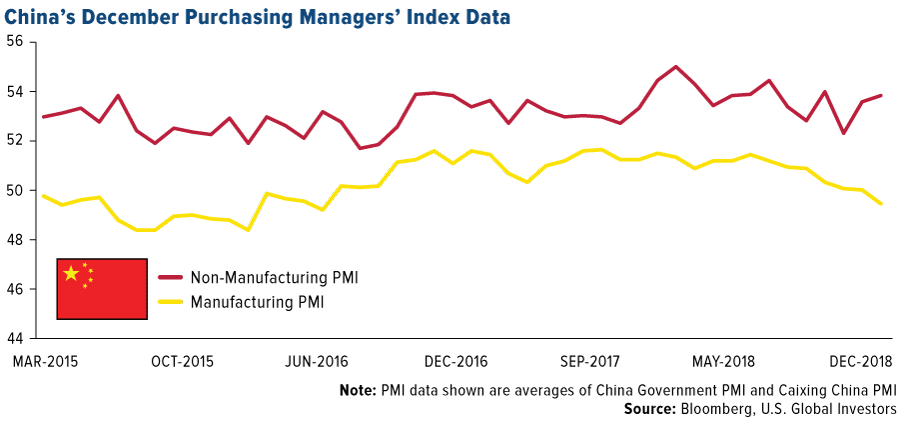
China’s manufacturing sector, meanwhile, contracted last month. Its official PMI reading fell slightly, from a neutral 50.0 in November to 49.4, as declining domestic demand and U.S. trade tariffs are squeezing the world’s second-largest economy. The price of copper hit a three-and-a-half-month low this week on the news.
U.S. factories also slowed in December, down sharply from 59.3 in November to 54.1 in December. That’s the most the gauge has fallen, in percentage-point terms, since the Great Recession.
Because the PMI is a forward-looking indicator of economic health, I urge investors to be cautious. And keep your eyes on the yield curve. The spread between the 10-year Treasury yield and three-month Treasury yield narrowed to only 15 basis points yesterday, its lowest level since September 2007—just a couple of months before the start of the financial crisis. An inverted yield curve, remember, is a sign that investors believe economic trouble could be near at hand.
The dollar looks positioned to revert back to its mean, and that’s when you want to have some exposure to gold. Keep in mind the 10 Percent Golden Rule—5 percent in gold bullion, the other 5 percent in well-managed gold mutual funds and ETFs.
Have a great weekend and Happy New Year to all!

Gold Market
This week spot gold closed at $1,285.15 up $4.05 per ounce, or 0.32 percent. Gold stocks, as measured by the NYSE Arca Gold Miners Index, ended the week higher by 3.03 percent. The S&P/TSX Venture Index came in up 6.40 percent. The U.S. Trade-Weighted Dollar slipped 0.21 percent.
| Date | Event | Survey | Actual | Prior |
|---|---|---|---|---|
| Jan-1 | Caixin China PMI Mfg | 50.2 | 49.7 | 50.2 |
| Jan-3 | ADP Employment Change | 180k | 271k | 157k |
| Jan-3 | Initial Jobless Claims | 220k | 231k | 221k |
| Jan-3 | ISM Manufacturing | 57.5 | 54.1 | 59.3 |
| Jan-4 | Eurozone CPI Core YoY | 1.0% | 1.0% | 1.0% |
| Jan-4 | Change in Nonfarm Payrolls | 184k | 312k | 176k |
| Jan-7-11 | New Home Sales | 569k | — | 544k |
| Jan-8-11 | Durable Goods Orders | — | — | 0.8% |
| Jan-10 | Initial Jobless Claims | 225k | — | 231k |
| Jan-11 | CPI YoY | 1.9% | — | 2.2% |
Strengths
- The best performing metal this week was platinum, up 4.05 percent, hitting a five-week high and puncturing through its 20-day moving average and is likely following gold to a higher relative valuation. Gold traders and analysts surveyed by Bloomberg have been bullish for eight consecutive weeks as the gold price heads toward $1,300 an ounce. As equity markets remain turbulent, gold is headed for a third weekly gain as investors are seeking perceived safe-haven assets. Investors have also been buying up silver as the white metal hit its highest level since July on Thursday. Naeem Aslam, chief market analyst at Think Markets U.K., told Bloomberg that it “looks like silver has gained momentum because of gold.”
- The yellow metal finished 2018 with its best quarter since March 2017 amid stock market volatility and the partial U.S. government shutdown. Bloomberg writes than in contrast, the S&P 500 saw its worst fourth quarter decline in a decade and the first negative annual return since 2015. Another case for gold bulls is that China’s PMI fell to 49.4 in December, which is lower than expected and below the 50 level that signals growth. ETFs added 75,380 troy ounces of gold to their holdings on Friday, marking five straight days of increases.
- Global head of precious metals sales at UBS, Edel Tully, wrote in a note this week that current gold buying interest pales in comparison to gold buying from 10 years ago. She writes that gold buying isn’t broad-based right now, but that it is slowly widening and momentum is building. Turkey’s gold reserves continue to climb each week. The central bank’s holdings rose $129 million from the previous week and are now worth $20 billion as of December 28, according to official figures from the central bank in Ankara.
Weaknesses
- The worst performing metal this week was gold, but still up by 0.32 percent. A gauge of U.S. manufacturing, the Institute for Supply Management index, fell to a two-year low of 54.1 this week, below expectations and marking the largest drop since October 2008. Gold futures declined on Friday after U.S. payroll data was released showing a rise of 312,000 in December. Average hourly wages rose 3.2 percent from a year earlier, which was by more than expected and the fastest pace since 2009. However, if you look closer, the data shows that the bulk of new jobs in December went to the oldest set of workers, those 55 and older. The prime age group, those aged 25-54, actually declined by 11,000 in December. Although the stock market liked the “strong” number it’s likely a head-fake considering the broad based weakening economic data seen earlier in the week.

- Commodity ETF inflows declined by 37 percent this week, according to Bloomberg data. Precious metals ETFs also saw inflows slow, with $468 million of gains, versus $934 million the previous week. Higher gold prices might be slowing Indian gold buying. Reuters reported that Indian discounts widened to a two-month high due to gold’s price surge.
- Guyana Goldfields shareholders are not happy with management. The company said this week that it will review an official request for a special shareholder meeting made by investors who are concerned about performance. The investors say they want a meeting to replace the board of directors, which is the latest of several recent actions in the mining industry as a whole.
Opportunities
- Merrill Lynch research analyst Michael Jalonen writes that the outlook for gold in 2019 is very promising, with the potential to reach $1,400 per ounce by the end of the year. This could happen due to U.S. twin deficits and China easing monetary policy. Barrick Gold’s new CEO says that shakeups in the gold industry are just starting. Mergers that made a big impact, such as the Barrick-Rangold Resources one last year, are just the beginning. Mark Bristow, who became the CEO after the merger, said in an interview with Bloomberg that “without a doubt, the industry needs transformation” and that “we believe we have started that.”
- Continuing the Merrill Lynch outlook from above, Jalonen writes that key themes in the gold market could be growth in free cash flow (FCF) and industry consolidation. He predicts that royalty and streaming companies will continue to generate robust FCF and pursue new deals to pay higher dividends. Additionally, the production weighted all in sustaining cost (AISC) is forecast to decline by 6 percent, to just $876 per ounce in 2019.
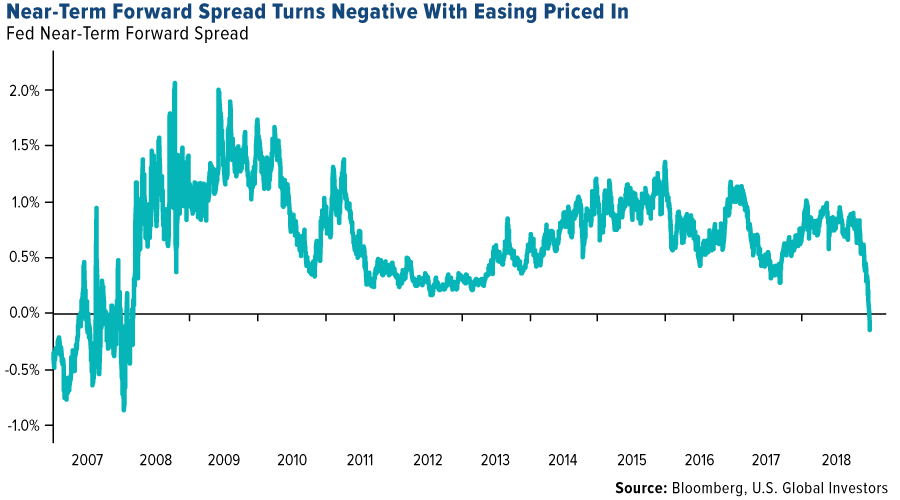
- Robert Kaplan, president of the Dallas Federal Reserve Bank, said this week that the U.S. central bank should pause rate hikes while it monitors the impact of tighter financial conditions and decelerating growth abroad, writes Bloomberg. Could there even be an interest rate cut coming? Bloomberg writes that bond traders have now fully priced in a cut by April 2020. The near-term forward spread, which shows the difference between the forward-rate implied by Treasury bills six quarters from now and the current three-month yield, fell below zero for the first time since March 2008, writes Bloomberg News. The gauge is seen as a proxy for traders’ outlook on Federal Reserve policy and implies that monetary policy easing is expected.
Threats
- DoubleLine Funds’ Jeffrey Gundlach weighed in on Apple’s recent revenue warning this week, reports CNBC, noting that this is the “kind of stuff that happens in a bear market.” In fact, Gundlach correctly called in mid-December the new lows witnessed in the stock market that came at the tail end of the year. For investors interested in buying the dips, Gundlach might be on to something here.
- As the threat of a synchronized global economic slowdown has pushed investors to government bonds for their perceived safety, Mark Gilbert writes for Bloomberg that “once again, shorting government debt is proving to be a widow-making trade.” The amount of negative-yielding debt has climbed by over 46 percent in the past three months, which is about to trash returns from shorting government bonds, the article continues. According to Hedge Fund Research, hedge funds have collectively lost more than 7 percent last year which makes this the industry’s worst year since 2011.
- Two years ago the government of Zimbabwe decriminalized gold digging in the country, reports a local news agency. However, this freedom has led to a surge in violence by robbers and mining mafia, with many miners now carrying machetes for self-defense. One artisanal gold miner who searches for the yellow metal in the disputed Gaika mine says that carrying a machete makes the difference between life and death, and success and failure, the article reads. He started carrying one after witnessing fellow miners being robbed of “their hard extracted gold ore in broad daylight.”

Index Summary
- The major market indices finished up this week. The Dow Jones Industrial Average gained 1.61 percent. The S&P 500 Stock Index rose 1.74 percent, while the Nasdaq Composite climbed 2.34 percent. The Russell 2000 small capitalization index gained 3.13 percent this week.
- The Hang Seng Composite lost 0.14 percent this week; while Taiwan was down 3.55 percent and the KOSPI fell 1.51 percent.
- The 10-year Treasury bond yield fell 5 basis points to 2.66 percent.
Domestic Equity Market
Strengths
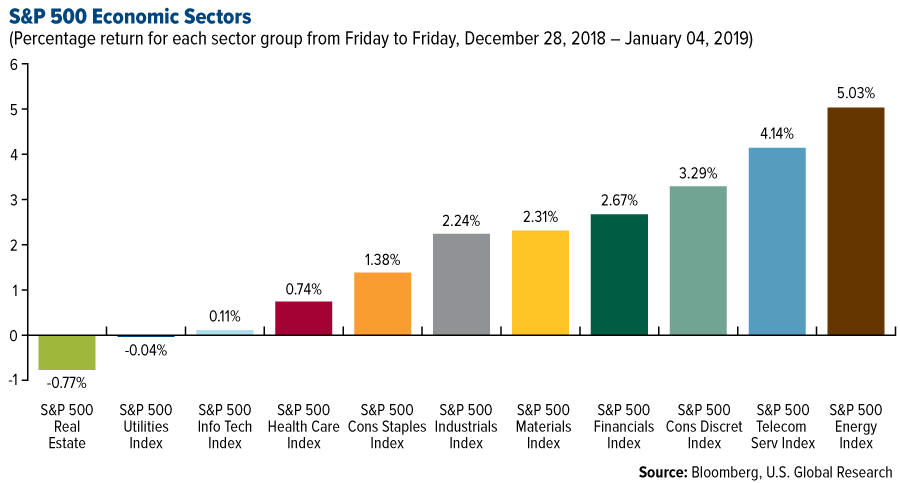
- Energy was the best performing sector of the week, decreasing by 5.03 percent versus an overall increase of 1.77 percent for the S&P 500.
- Celgene was the best performing stock for the week, increasing 35.99 percent.
- GE started off the new year with a bang, with its shares surging 6.21 percent on Wednesday. If the gains hold up all year, it would be the best annual performance for the industrial conglomerate since 2015.
Weaknesses
- Real estate was the worst performing sector for the week, decreasing by 0.77 percent versus an overall increase of 1.77 percent for the S&P 500.
- Align Technology was the worst performing stock for the week, falling 10.36 percent.
- 2018 was the stock market’s worst year since the financial crisis. The S&P 500 fell 6.2 percent last year, capped off by a 9.2 percent dip in December alone — the worst final month of the year since 1931.
Opportunities
- Technical analysts at Oppenheimer told clients that they’re watching for one indicator that would signal the stock market has bottomed. They are paying close attention to the number of NYSE-listed stocks trading above their 200-day moving averages. "At the lowest point of the market’s Q4 correction, only 8 percent of NYSE stocks were above their 200-day moving average—a deeply oversold condition that’s been followed by above-average gains over the next 6-12 months but below-average returns over the first 1-3 months," a team led by Ari Wald, Oppenheimer’s head of technical analysis, wrote in a note on Tuesday. Wald and his team wrote this measure of breadth rose to 70 percent in prior years before the start of a new bull run. "In addition, to confirm the resumption of a new bull market we’d like to see this internal breadth gauge surge to 70 percent like it did at the start of new bulls in 1994, 2003, 2009, 2013, and 2016," he said.
- China’s Online Game Ethics Committee, a newly formed regulatory body, recently approved 80 new video games, ending the freeze that began in March 2018. This measure could lead to a revenue jump for video game stocks.
- Amazon is planning to expand Whole Foods. Employees of the grocery chain have visited parts of Western North America to look for potential store locations that would allow more customers to be within Prime Now’s two-hour delivery-service range, write the Wall Street Journal.
Threats
- Apple shocked financial markets this week when it announced that it was lowering its revenue guidance for its first fiscal quarter ending December. The company had previously told investors to expect revenue between $89 billion and $93 billion, but it revised that estimate down to $84 billion. Apple CEO Tim Cook placed a significant portion of the blame for its slowdown on China’s economic slowdown, which Cook said was caused in part by President Donald Trump’s trade war. "We believe the economic environment in China has been further impacted by rising trade tensions with the United States," Cook wrote.
- Tesla fell as much as 9.34 percent, to $301.49 a share on Monday, after the company missed on vehicle deliveries and cut prices for three of its models. Tesla missed on annual deliveries for the Model 3, Model S, and Model X, and announced a $2,000 price reduction for all the three vehicles in the U.S. starting Wednesday.
- Volkswagen is reportedly preparing to write off its $300 million investment in Gett. Initially marketed as a rival to Uber, Gett has failed to gain ground against the competition.
The Economy and Bond Market
Strengths
- Job creation ended 2018 on a very strong note, with nonfarm payrolls surging by 312,000 in December. The labor force participation rate, meanwhile, rose to 63.1 percent. Economists surveyed by Dow Jones had been expecting job growth of just 176,000.
- U.S. wages jumped 3.2 percent from a year ago and 0.4 percent over the previous month. The year-over-year increase is tied with October for the best month since April 2009. The wage figures were above expectations of 3 percent on the year and 0.3 percent from November.
- Federal Reserve Chairman Jerome Powell, speaking Friday, praised the jobs numbers and said U.S. economic data are on track for good momentum into the new year. He noted broad wage gains and said officials would “be patient” and “flexible” with policy.
Weaknesses
- Activity in the U.S. manufacturing sector expanded at a much slower pace than expected last month, according to the Institute for Supply Management (ISM). The ISM manufacturing index fell to 54.1 in December, its lowest level since November 2016. Economists polled by Refinitiv expected the index to slip to 57.9 in December, down from 59.3 in November.
- The unemployment rate for December rose to 3.9 percent from the previous 3.7 percent. Economists had projected the unemployment rate to fall to 3.6 percent.
- The number of Americans filing applications for jobless benefits increased more than expected last week. Initial claims rose 10,000 to a seasonally adjusted 231,000 for the week ended Dec. 29, the Labor Department said on Thursday. Economists polled by Reuters had forecast claims increasing to 220,000 in the latest week.
Opportunities
- The Fed will be in the headlines next Wednesday as the minutes of the December 18-19 Federal Open Markets Committee (FOMC) meeting are published. That meeting’s comments, during the heat of the December stock market plunge, will be contrasted with the latest remarks following the strong December job report.
- Trade figures for November will be out on Tuesday, where the trade balance is forecast to have narrowed slightly. That could be good news for the Donald Trump administration, while senior officials from the U.S. and China meet on January 7-8 to discuss how to implement the points agreed between President Trump and President Xi at the G20 summit. Should the meeting prove fruitless, market sentiment could take another turn for the worse. However, if the two sides make substantial progress, risk appetite could receive a massive boost.
- Trump touted progress on trade talks with China: "Just had a long and very good call with President Xi of China," President Donald Trump tweeted Saturday. "Deal is moving along very well. If made, it will be very comprehensive, covering all subjects, areas and points of dispute. Big progress being made!"
Threats
- The U.S. near-term forward spread, which shows the difference between the forward rate implied by Treasury bills six quarters from today and the current three-month yield, dipped into negative territory this week for the first time since 2008. Anomalies turning up in money-market rates indicate traders might be looking ahead to a possible interest rate cut as the Fed shifts policy to spur slowing growth, according to Bloomberg.
- The global economy could already be on an “irreversible path” to a downturn, according to one Wall Street analyst. The credit cycle is heading toward a plateau and then a downturn, according to Naka Matsuzawa, chief Japan rates strategist at Nomura.
- Studies of trade-war impacts by the International Monetary Fund (IMF) and the European Central Bank (ECB) found the "likely impact on the U.S. economy to be significantly more negative than on China," analysts Janet Henry and James Pomeroy said in a research note. "Whereas China has been benefiting from strong import demand in most of its other trading partners except for the U.S. (and Germany, due to cars)," they said, "the U.S. has not."
Energy and Natural Resources Market
Strengths
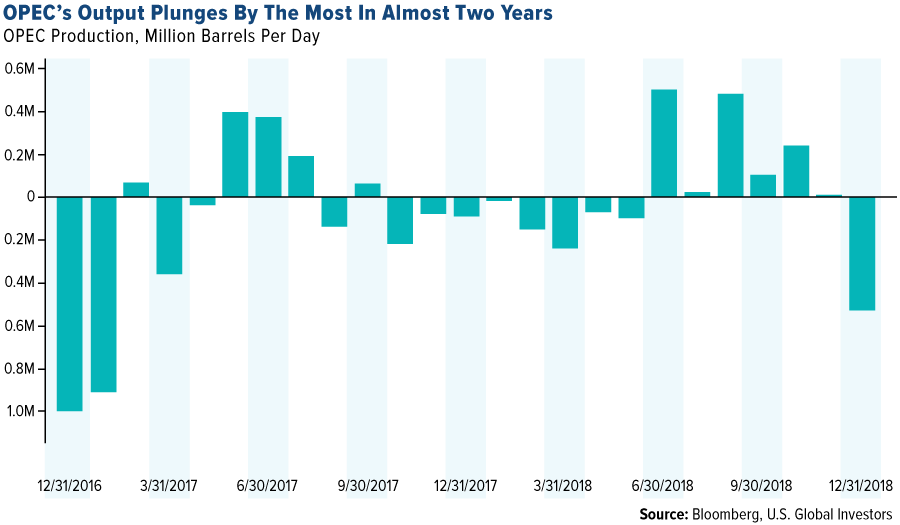
- Oil was the best performing commodity, rising 9.73 percent for the week. The commodity rebounded from three consecutive weekly drops after Saudi Arabia slashed production in December in anticipation of the new OPEC supply cut deal.
- The best performing sector for the week was the S&P/TSX Oil & Gas Exploration and Production Index. The index rose 6.74 percent, rebounding from a deep oversold condition as both crude oil prices and Canadian dollar rebounded.
- The best performing major natural resource stock for the week was Centamin PLC. The Africa-focused gold producer rose 12.24 percent, soaring to 7-month highs on higher gold prices, and after numerous technical analysts highlighted bullish formations that provide attractive entry points for investors.
Weaknesses
- Natural gas was the worst performing commodity for the week. The commodity dropped 8.33 percent after the NOAA advised temperatures are expected to be warmer across most of the U.S. in the next week. Inventories were also expected to draw by less than seasonal averages.
- The worst performing sector this week was the S&P/TSX Gold 1500 Index. The index was up only 34 basis points after gold prices retreated from eight-month highs following a stellar U.S. jobs report.
- The worst performing stock for the period was Lotte Chemical Corp. The South Korean petrochemical refiner dropped 7.40 percent after analysts highlighted weaker demand as a result of lower global PMIs, while supply costs have begun to recover, which squeezes margins for the entire Asian petrochemical sector.
Opportunities
- Oil is set for a sizeable gain on Saudi Arabia supply cuts. The oil price benchmark is set to advance this week, ending three consecutive weeks of losses. Prices rallied as Saudi Arabia reduced output even before OPEC’s cuts deal went into effect this month.
- China announced a new cut to its bank’s reserve ratio requirements to ratchet up support for 2019. China’s central bank acted to release cash into the economy to support growth, cutting the amount of cash lenders must hold as reserves by 1 percentage point. The aim is to support Chinese market liquidity and offset the funding squeeze ahead of the Chinese New Year, said the bank.
- U.S.-China trade talks are set to resume in person next week with a delegation of U.S. officials arriving in Beijing. The two countries will hold vice-ministerial level talks, as both sides look to end a dispute that is inflicting increasing pain on both economies and roiling global financial markets.
Threats
- U.S. ISM Manufacturing PMI dropped from 59.3 to 54.1 month-over-month, in what constitutes the worst monthly drop since 2008. All sub-indices registered drops, with new orders and production suffering worrying 11- and 6.3-point drops respectively.
- China’s private sector-focused Markit Manufacturing PMI dropped below the 50-point line. The December reading came in at 47.9, as manufacturing activity contracted for the first time since early 2017. New export orders were the key driver to the downside, suggesting trade war concerns are now affecting manufacturing decisions.
- The main issue for base metals in 2019 is whether Chinese infrastructure stimulus can offset slowing property demand, according to BMO analysts. “It is fair to say the jury is still out on whether efforts thus far are sufficient,” referring to the amount of stimulus promised by Chinese Premier Li Keqiang, and the central bank.

Emerging Europe
Strengths
- Romania was the best performing country this week, gaining 3.4 percent. The Romanian government adopted a new banking tax that was enacted on January 1, which should have a less negative impact on banks than the original banking tax proposed last month would have had.
- The Russian ruble was the best relative performing currency this week, gaining 3.4 percent against the U.S. dollar. The Russian currency bounced back with the price of oil, which gained 9.4 percent in the past five days.
- Healthcare was the best performing sector among eastern European markets this week.
Weaknesses
- Turkey was the worst performing country this week, losing 1.8 percent. Turkish inflation slowed for a second month. Consumer prices rose 20.3 percent in December from a year earlier, compared with an increase of 21.6 percent in November. Turkish equites remain volatile and highly sensitive to global trade war talks and geopolitical developments.
- The Turkish lira was the worst performing currency this week, losing 1.1 percent against the U.S. dollar. The biggest intraday drop in the lira was recorded on Thursday, the same day when retail investors in Japan cut their net long positions in the lira by the most since August, according to data from the Tokyo Financial Exchange.
- Industrial was the worst performing sector among eastern European markets this week.
Opportunities
- The Czech Republic state budget finished 2018 with a 2.9 billion koruna surplus, beating forecasts for a deficit of 50 billion ($2.2 billion). The budget has been boosted by a growing economy and unemployment at a two-decade low, which has increased wages. This year government debt is expected to drop to 31.9 percent of GDP next year, down from 33 percent this year, which is one of the lowest figures in the European Union.
- Russian oil production in 2018 rose to a post-Soviet record high of 11.16 million barrels per day (bpd), versus 10.98 million bps in the prior year, despite an agreement with OPEC to cut production. Rosneft, the world’s largest oil producer by output, raised its production by 4.6 percent year-over-year in December, while Lukoil and Surgutneftegaz both increased output by 2.5 percent. Tatneft’s oil production surged by 9.3 percent and, improved profit margins. The United States became the world’s biggest crude producer in 2018, pumping 11.6 million bpd, which is more than Saudi Arabia or Russia.
- Turkey’s preliminary trade deficit shrank 71 percent year-ver-year in December to $2.68 billion. Exports rose 0.4 percent to $13.9 billion, while imports fell 28 percent to $16.6 billion. A weaker lira is helping to bring the trade balance in line.
Threats
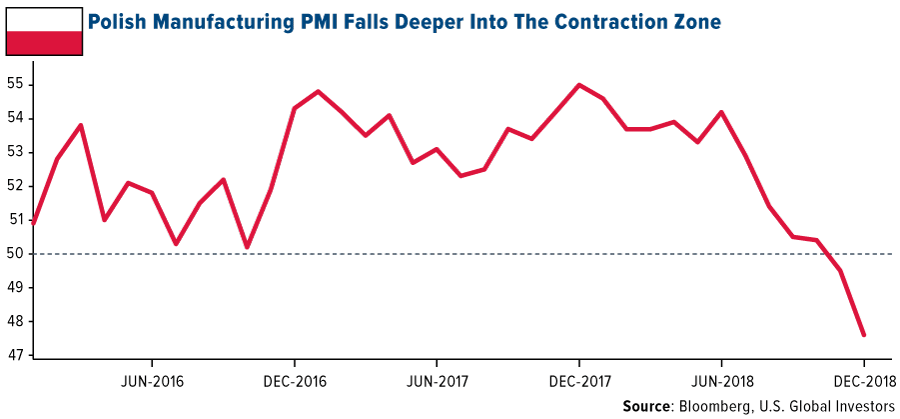
- Manufacturing performance in Poland worsened by more than expected in December, as fading demand from abroad weighted on exports. The data on new orders suggest that the trend in output will remain negative in the short term, weighing on economic growth. The PMI reading fell to 47.6, the lowest in about six years. The final Eurozone PMI was unchanged at 51.4 from the preliminary flash reading released at the end of December. The Eurozone PMI stayed above the 50 level that separates growth from contraction; however, it is at a four year low.
- Eurozone inflation hit an eight-month low of 1.6 percent in December. The decline was largely driven by oil. Central bank policymakers expected the decline in inflation, yet ended its bond-buying program at the end of the last year. Most analysts predict a rate hike at the end of 2019.
- Hungarian labor unions are pushing to resume the anti-government protests to repeal the controversial overtime law, dubbed the “slave law”, passed in December, which raised the amount of extra work employers can demand by 60 percent annually. Already thousands of Hungarians have indicated a willingness to resume demonstrations on Saturday in Budapest, followed by weeks of rallies last month.
China Region
Strengths
- The Philippines’ Stock Exchange Index jumped 4.01 percent over the last week, handily outpacing other regional indices since last Friday.
- Telecommunications was the top performing sector in Hong Kong’s Hang Seng Composite Index, climbing 2.79 percent. Properties and construction, energy and even financials also finished positive for the week following China’s Friday reserve ratio cut.
- The Caixin China Services PMI number actually clocked in as a “beat,” rising to 53.9 from the prior reading of 53.8 and beating analysts’ expectations for only a 53.0 print.
Weaknesses
- Taiwan’s TWSE Index declined by 3.54 percent, suffering heavily as collateral damage in technology juggernaut Apple’s downward revision this week.
- Materials was the worst performing sector in the Hang Seng Composite Index for the week, falling 2.81 percent.
- While the Caixin Services PMI did beat expectations, the Caixin Manufacturing PMI tumbled to contractionary levels of 49.7, well shy of expectations for an expansionary 50.2 print and down from the prior reading of 50.2.
Opportunities
- One positive development was the announcement of a reserve ratio requirement cut in China on Friday, as well as positive statements from the PBOC on continuing financial opening and the strong encouragement by Premier Li Keqiang to banks that they take full advantage of the RRR cut.
- Midlevel trade talks are now set between the Americans and Chinese in Beijing next week, January 7-8.
- The latest Philippine CPI print showed only a 5.1 percent gain in December, less than analysts’ median forecast of 5.6 percent, and down from the also-lower prior print of 6.0 percent.
Threats
- Apple’s lowered guidance and specific citation of trade tensions placing pressure on China’s economy as, in CEO Tim Cook’s opinion, indicated by slowing second-half sales in that country, may be an excellent demonstration that a slowing Chinese economy may also begin to have extra-China effects, obviously (see: AAPL, or Taiwan’s TWSE this week, for example).
- The U.S. State Department raised its Travel Advisory status for China to “Level 2—Exercise Increased Caution” levels, noting that American citizens ought to “[e]xercise increased caution in China due to arbitrary enforcement of local laws as well as special restrictions on dual-U.S.-Chinese nationals,” particularly citing the controversial use of “exit bans.”
- The Shanghai Composite put in new 52-week lows on Friday. Yes, there was a RRR cut. Yes, there were some positive comments. And yes, there is a trade “truce” with talks upcoming. However, the index still hit 52-week lows, which is worth noting, though the SHCOMP did close up 2.05 percent on the day.
Blockchain and Digital Currencies
Strengths
- Of the cryptocurrencies tracked by CoinMarketCap, the best performing for the week ended January 4 was CryCash, up 425.65 percent.
- Mid-week cryptocurrencies experienced a broad-based rally, reports MarketWatch, with $8 billion being added to the total value of all cryptos in a 24-hour time frame. All major coins showed solid gains on Wednesday, though retreating Thursday, with a single bitcoin up 3 percent from Tuesday to Wednesday. In related news, Mike Novogratz purchased another 2.7 percent of his cryptocurrency venture fund Galaxy Digital Holdings, reports Coindesk. The Galaxy CEO invested nearly $5 million more, or 7.5 million ordinary shares of the company, according to a press release. The stock, which trades on the Toronto Stock Exchange, rose 21 percent on the news Wednesday morning, the article continues.
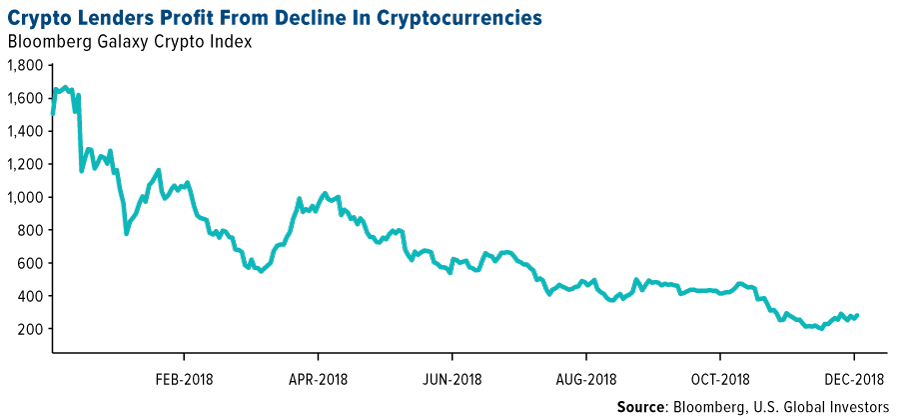
- According to Bloomberg, lending in the cryptocurrency world is one corner of the industry that is not struggling or shutting down. “Creditors focusing on the crypto arena say they’re finding strong demand from borrowers who don’t want to sell their virtual coins at depressed prices, as well as from big investors eager to borrow coins for short selling,” the article reads. Lenders pivoted into new roles from 2017 to 2018 and now it seems that this niche could fare even better in bad times than in good.
Weaknesses
- Of the cryptocurrencies tracked by CoinMarketCap, the worst performing for the week ended January 4 was Eternal Token, down 73.70 percent.
- According to Bloomberg Intelligence analysts Mike McGlone and James Seyffart, the average price for bitcoin is likely to be halved in 2019. According to their view, “it’s likely to decline more than 50 percent in 2019, exceeding the 48 percent drop in 2015.” Both analysts anticipate a new price range of $1,500 to $6,500, Bloomberg reports.
- As 2018 came to a close, bitcoin was able to close out its worst year on record last week. Coindesk reports that the leading cryptocurrency’s 2018 performance of a “more than 70 percent depreciation from its opening price of $13,062, is considerably worse than the previous record holder, 2014, the year when its price fell roughly 55 percent open to close.” A review of the price movement points to two standout technical indicators according to the article: 1) the moving average death cross and 2) breaking support of $6,000.
Opportunities
- DX.Exchange, a Nasdaq-powered cryptocurrency startup announced on Thursday that it has plans to allow its clients to indirectly purchase shares of major firms through a token-based platform, writes Coindesk. The trading platform is set to launch on January 7, which will let clients “purchase crypto tokens representing shares in different technology firms listed on the Nasdaq exchange,” the article continues. Fiat currencies and select digital currencies will be allowed to purchase the tokens.
- Digital retail giant Overstock.com announced on its investor portal Thursday that it plans to pay a portion of its state commercial activity taxes in Ohio using bitcoin this year, reports Coindesk. This would make it the first major business to do so. As you may recall, last year the state of Ohio announced it would allow businesses to pay taxes in the digital currency.
- The State of New York announced it was forming a cryptocurrency “task force” to help the state government better understand digital coins and their underlying blockchain technology. The group, composed of consumers, investors, technologists and other experts, is tasked with presenting the state with proposals on how it can best define, utilize and regulate cryptocurrencies. The report is due in December 2020.
Threats
- According to Anthony Pompliano, founder and chief executive of Morgan Creek Digital, after a painful 2018 for the cryptocurrency industry, the likelihood for further declines is putting major pressure on exchanges to adapt. “As prices stay depressed, crypto exchanges will look for revenue growth business opportunities by growing their user base in new geographies and/or adding new crypto assets,” Pompliano wrote. While this threat should be taken seriously by exchanges, which will need to spend more money and time to obtain licenses and approvals in new jurisdictions, MarketWatch explains that by no means is this an impossible task.
- In a blog post on Slaw, a Canadian law magazine, Alberta-based attorney and former software developer Jason Morris makes the case that, although still promising, much of the hype surrounding blockchain’s potential applications are “nonsense.” “Blockchain is not the next industrial revolution,” he writes. “You and your clients are not going to be using the blockchain for everything. It is not AI. It is not the same thing as a smart contract. Courts and law firms will find little use for it. Governments and businesses will find use for it primarily when dealing with people in other jurisdictions, or untrusted parties.”
- Despite expectations to the contrary, the Indian government informed the parliament this week that it was in no hurry to set rules or guidelines about cryptocurrencies, which are sorely needed to aid investors and cryptocurrency exchanges. According to India’s finance minister, the government was proceeding with “due caution” and withholding “clear recommendations” because there is currently a lack of “globally acceptable solution.”
January 2, 2019Peak Gold Could Send Prices Higher In 2019 |
January 2, 2019Invest the Warren Buffett Way in 2019 |
December 27, 2018Frank Holmes Reflects on 2018 |
|||
Leaders and Laggards
| Index | Close | Weekly Change($) |
Weekly Change(%) |
|---|---|---|---|
| S&P/TSX Global Gold Index | 183.68 | +0.26 | +0.14% |
| Gold Futures | 1,286.40 | +3.40 | +0.27% |
| Natural Gas Futures | 3.03 | -0.28 | -8.39% |
| S&P/TSX VENTURE COMP IDX | 586.81 | +34.72 | +6.29% |
| 10-Yr Treasury Bond | 2.66 | -0.06 | -2.10% |
| Nasdaq | 6,738.86 | +154.34 | +2.34% |
| Oil Futures | 48.25 | +2.92 | +6.44% |
| Hang Seng Composite Index | 3,400.06 | -4.72 | -0.14% |
| S&P 500 | 2,528.94 | +43.20 | +1.74% |
| DJIA | 23,433.16 | +370.76 | +1.61% |
| Korean KOSPI Index | 2,010.25 | -30.79 | -1.51% |
| Russell 2000 | 1,379.86 | +41.94 | +3.13% |
| S&P Energy | 443.41 | +21.25 | +5.03% |
| S&P Basic Materials | 321.35 | +7.25 | +2.31% |
| XAU | 71.87 | +2.19 | +3.14% |
| Index | Close | Monthly Change($) |
Monthly Change(%) |
|---|---|---|---|
| Natural Gas Futures | 3.03 | -1.44 | -32.29% |
| S&P/TSX Global Gold Index | 183.68 | +12.56 | +7.34% |
| 10-Yr Treasury Bond | 2.66 | -0.25 | -8.61% |
| Oil Futures | 48.25 | -4.64 | -8.77% |
| Gold Futures | 1,286.40 | +43.80 | +3.52% |
| S&P 500 | 2,528.94 | -245.08 | -8.83% |
| S&P Energy | 443.41 | -39.52 | -8.18% |
| Hang Seng Composite Index | 3,400.06 | -213.80 | -5.92% |
| DJIA | 23,433.16 | -1,593.91 | -6.37% |
| Korean KOSPI Index | 2,010.25 | -91.06 | -4.33% |
| Nasdaq | 6,738.86 | -419.57 | -5.86% |
| S&P Basic Materials | 321.35 | -15.03 | -4.47% |
| Russell 2000 | 1,379.86 | -100.89 | -6.81% |
| S&P/TSX VENTURE COMP IDX | 586.81 | +23.70 | +4.21% |
| XAU | 71.87 | +5.71 | +8.63% |
| Index | Close | Quarterly Change($) |
Quarterly Change(%) |
|---|---|---|---|
| Natural Gas Futures | 3.03 | -0.14 | -4.39% |
| 10-Yr Treasury Bond | 2.66 | -0.53 | -16.47% |
| DJIA | 23,433.16 | -3,194.32 | -12.00% |
| Oil Futures | 48.25 | -26.08 | -35.09% |
| S&P 500 | 2,528.94 | -372.67 | -12.84% |
| Gold Futures | 1,286.40 | +79.00 | +6.54% |
| S&P Energy | 443.41 | -128.20 | -22.43% |
| Nasdaq | 6,738.86 | -1,140.65 | -14.48% |
| Korean KOSPI Index | 2,010.25 | -264.24 | -11.62% |
| S&P Basic Materials | 321.35 | -42.87 | -11.77% |
| Russell 2000 | 1,379.86 | -267.05 | -16.22% |
| Hang Seng Composite Index | 3,400.06 | -213.42 | -5.91% |
| S&P/TSX Global Gold Index | 183.68 | +26.09 | +16.56% |
| S&P/TSX VENTURE COMP IDX | 586.81 | -116.22 | -16.53% |
| XAU | 71.87 | +5.94 | +9.01% |
U.S. Global Investors, Inc. is an investment adviser registered with the Securities and Exchange Commission ("SEC"). This does not mean that we are sponsored, recommended, or approved by the SEC, or that our abilities or qualifications in any respect have been passed upon by the SEC or any officer of the SEC.
This commentary should not be considered a solicitation or offering of any investment product.
Certain materials in this commentary may contain dated information. The information provided was current at the time of publication.
Some links above may be directed to third-party websites. U.S. Global Investors does not endorse all information supplied by these websites and is not responsible for their content.
Holdings may change daily. Holdings are reported as of the most recent quarter-end. The following securities mentioned in the article were held by one or more accounts managed by U.S. Global Investors as of (09/30/2018):
Centamin PLC
Lotte Chemical Corp
Tatneft PJSC
Lukoil PJSC
Surgutneftegas PJSC
Guyana Goldfields Inc
*The above-mentioned indices are not total returns. These returns reflect simple appreciation only and do not reflect dividend reinvestment.
The Dow Jones Industrial Average is a price-weighted average of 30 blue chip stocks that are generally leaders in their industry. The S&P 500 Stock Index is a widely recognized capitalization-weighted index of 500 common stock prices in U.S. companies.
The Nasdaq Composite Index is a capitalization-weighted index of all Nasdaq National Market and SmallCap stocks.
The Russell 2000 Index is a U.S. equity index measuring the performance of the 2,000 smallest companies in the Russell 3000, a widely recognized small-cap index.
The Hang Seng Composite Index is a market capitalization-weighted index that comprises the top 200 companies listed on Stock Exchange of Hong Kong, based on average market cap for the 12 months.
The Taiwan Stock Exchange Index is a capitalization-weighted index of all listed common shares traded on the Taiwan Stock Exchange.
The Korea Stock Price Index is a capitalization-weighted index of all common shares and preferred shares on the Korean Stock Exchanges.
The Philadelphia Stock Exchange Gold and Silver Index (XAU) is a capitalization-weighted index that includes the leading companies involved in the mining of gold and silver.
The U.S. Trade Weighted Dollar Index provides a general indication of the international value of the U.S. dollar.
The S&P/TSX Canadian Gold Capped Sector Index is a modified capitalization-weighted index, whose equity weights are capped 25 percent and index constituents are derived from a subset stock pool of S&P/TSX Composite Index stocks.
The S&P 500 Energy Index is a capitalization-weighted index that tracks the companies in the energy sector as a subset of the S&P 500.
The S&P 500 Materials Index is a capitalization-weighted index that tracks the companies in the material sector as a subset of the S&P 500.
The S&P 500 Financials Index is a capitalization-weighted index. The index was developed with a base level of 10 for the 1941-43 base period.
The S&P 500 Industrials Index is a Materials Index is a capitalization-weighted index that tracks the companies in the industrial sector as a subset of the S&P 500.
The S&P 500 Consumer Discretionary Index is a capitalization-weighted index that tracks the companies in the consumer discretionary sector as a subset of the S&P 500.
The S&P 500 Information Technology Index is a capitalization-weighted index that tracks the companies in the information technology sector as a subset of the S&P 500.
The S&P 500 Consumer Staples Index is a Materials Index is a capitalization-weighted index that tracks the companies in the consumer staples sector as a subset of the S&P 500.
The S&P 500 Utilities Index is a capitalization-weighted index that tracks the companies in the utilities sector as a subset of the S&P 500.
The S&P 500 Healthcare Index is a capitalization-weighted index that tracks the companies in the healthcare sector as a subset of the S&P 500.
The S&P 500 Telecom Index is a Materials Index is a capitalization-weighted index that tracks the companies in the telecom sector as a subset of the S&P 500.
The NYSE Arca Gold Miners Index is a modified market capitalization weighted index comprised of publicly traded companies involved primarily in the mining for gold and silver.
The Consumer Price Index (CPI) is one of the most widely recognized price measures for tracking the price of a market basket of goods and services purchased by individuals. The weights of components are based on consumer spending patterns.
The Purchasing Manager’s Index is an indicator of the economic health of the manufacturing sector. The PMI index is based on five major indicators: new orders, inventory levels, production, supplier deliveries and the employment environment.
The S&P/TSX Venture Composite Index is a broad market indicator for the Canadian venture capital market. The index is market capitalization weighted and, at its inception, included 531 companies. A quarterly revision process is used to remove companies that comprise less than 0.05% of the weight of the index, and add companies whose weight, when included, will be greater than 0.05% of the index.
Gross domestic product (GDP) is the monetary value of all the finished goods and services produced within a country’s borders in a specific time period, though GDP is usually calculated on an annual basis. It includes all of private and public consumption, government outlays, investments and exports less imports that occur within a defined territory.
The Bloomberg Galaxy Crypto Index is designed to measure the performance of the largest cryptocurrencies traded in U.S. dollar.
The S&P Oil & Gas Exploration & Production Select Industry Index represents the oil and gas exploration and production sub-industry portion of the S&P Total Markets Index (TMI). The S&P TMI tracks all the U.S. common stocks listed on the NYSE, AMEX, NASDAQ National Market and NASDAQ Small Cap exchanges. The Oil & Gas Exploration Index is an equal weighted market capitalization index.
The S&P 500 Fertilizers & Agricultural Chemicals Index is a capitalization-weighted index. The index was developed with a base level of 10 for the 1941-43 base period.
The S&P/TSX Venture Gold (Sub Industry) Index consists of all members of the S&P/TSX Venture Composite that are classified within the GICS gold sub-industry.
The STOXX Europe 600 Index is derived from the STOXX Europe Total Market Index (TMI) and is a subset of the STOXX Global 1800 Index. With a fixed number of 600 components, the STOXX Europe 600 Index represents large, mid and small capitalization companies across 18 countries of the European region: Austria, Belgium, Czech Republic, Denmark, Finland, France, Germany, Greece, Ireland, Italy, Luxembourg, the Netherlands, Norway, Portugal, Spain, Sweden, Switzerland and the United Kingdom.
The FedWatch Tool calculates unconditional probabilities of Federal Open Market Committee (FOMC) meeting outcomes to generate a binary probability tree. CME Group lists 30-Day Federal Funds Futures (FF) futures, prices of which incorporate market expectations of average daily Federal Funds Effective Rate (FFER) levels during futures contract months. The FFER is published by the Federal Reserve Bank of New York each day, and is calculated as a transaction-volume weighted average of the previous day’s rates on trades arranged by major brokers in the market for overnight unsecured loans between depository institutions.
In finance, mean reversion is the assumption that a stock’s price will tend to move to the average price over time.
The labor force participation rate measures an economy’s active labor force and is the sum of all employed workers divided by the working age population.
The Philippine Stock Exchange PSEi Index is composed of stocks representative of the industrial, properties, services, holding firms, financial and mining & oil sectors of the Philippines Stock Exchange.
The TWSE, or TAIEX, Index is a capitalization-weighted index of all listed common shares traded on the Taiwan Stock Exchange. The index was based in 1966. The index is also known as the TSEC Index.
Free Cash Flow (FCF) represents the cash that a company is able to generate after laying out the money required to maintain or expand its asset base.
