


No Country Has Ever Taxed Itself into Prosperity
Date Posted: May 7, 2021
Read time: 48 min
NULL
U.S. Global Investors Announces Third-Quarter Results Webcast, with an Update on HIVE Blockchain Technologies
By Frank Holmes
CEO and Chief Investment Officer
U.S. Global Investors
We’ll be hosting a webcast on Monday, May 10, 2021, at 7:30 a.m. Central time to discuss our results for the third quarter 2021. An update on HIVE Blockchain Technologies, our strategic exposure to the crypto asset boom, will also be discussed. To register for the webcast, click here.

Violent protests have erupted in the streets of Bogota, Cali and other cities in Colombia. The immediate cause? Proposed reforms to the South American country’s tax system, which would have lifted taxes on everything from salaries and dividends to fossil fuels, single-use plastic items and more.
According to reports, the protests have involved citizens of all walks of life, including truckers, taxi drivers and health care workers. Overworked doctors, nurses and paramedics have walked off the job to bring attention to salary delays.
In response to the unrest, Colombian President Ivan Marquez announced on Sunday that he was withdrawing the tax reform proposal. The country’s finance minister resigned the following day.
But the protests continue, just as they did in Hong Kong in 2019 and 2020 after a controversial extradition bill was canceled. At least 24 Colombians are believed to have lost their lives so far during clashes with police.
Money Flows Where It’s Respected Most
It’s against this incendiary backdrop that U.S. lawmakers are having their own tax reform debate.
President Joe Biden seeks to make a number of adjustments to the tax code, including raising the top income rate to 39.6%. The tax on capital gains, currently at 20%, would be doubled. And corporate taxes, which were lowered to 21% in the Tax Cuts and Jobs Act of 2017, would increase to between 25% and 28%.
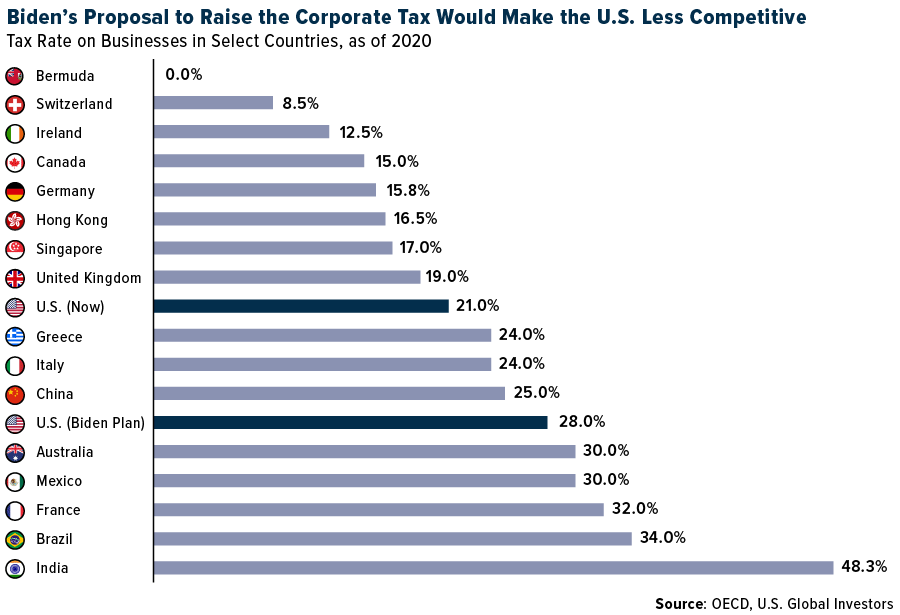
Before 2017, the top U.S. rate on corporate income was 35%, making it one of the highest rates in the world—higher, even, than Mexico, France and Brazil. I and most other executives celebrated the change because it made the U.S. far more competitive as a place to do business in. As I’ve said many times before, money flows where it’s respected most. Around the time of the tax bill’s signing, private business investment in the U.S. came rushing back, before stalling in late 2019 as the global economy slowed and articles of impeachment against President Donald Trump looked more and more likely.
Now, as domestic investment is finally starting to trickle back following the worst of the pandemic, the U.S. risks scaring money away again by raising corporate taxes.

To make matters worse, Treasury Secretary Janet Yellen said this week that she and a number of other finance ministers are actively negotiating a global minimum tax on corporate income. If implemented, the decision would stand as yet another example of unelected bureaucrats imposing anti-capital, anti-competition policies on the rest of us. Obviously I don’t condone the violence we’re seeing in Colombia right now, but I view it as a cautionary tale of what could happen when people are faced with the real possibility of having even more of their hard-earned money withheld from them.
One of my all-time favorite quotes comes from Winston Churchill, who was just as witty as he was a great leader: “We contend that for a nation to try to tax itself into prosperity is like a man standing in a bucket and trying to lift himself up by the handle.”
On the contrary, countries have found prosperity by eliminating taxes. Take China. In 1978, Deng Xiaoping created special economic zones (SEZs) along the coastline, including Shenzhen, which invited millions of dollars in foreign investment to pour in. It’s hard to imagine China becoming the second largest economy had this decision not been made.
Net Short Bets on the Dollar Increase. Time to Scoop Up Gold?
It may be no coincidence that the value of the U.S. dollar decreased more than a full percent this week against a basket of international currencies. This comes as hedge funds and other speculative investors have increased their net short positions against the greenback in recent weeks. What’s more, the International Monetary Fund (IMF) reported this week that the share of U.S. dollar reserves held by global central banks fell to 59% in the fourth quarter of 2020, a 25-year low that’s down from 71% since the euro made its debut in 1999.
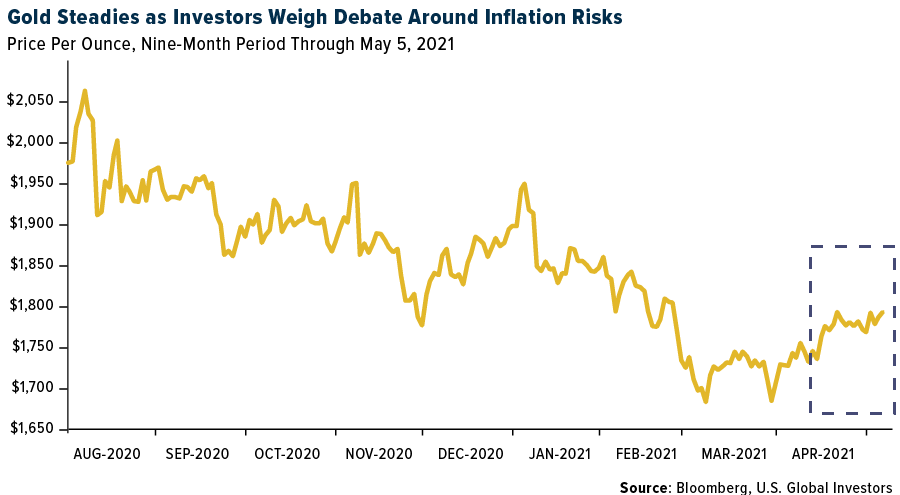
What does this mean for assets that are priced in U.S. dollars such as gold? As you might have expected, the yellow metal jumped back above $1,800 an ounce for the first time since late February. Gold rose more than 4% for the week, beating its digital counterpart Bitcoin, which remained mostly flat.
The U.S. Dollar Index is currently at 90.2. I believe if it traded below 90, it could trigger some technical gold buying as inflation concerns mount.
That’s precisely the reason why legendary investor Sam Zell finds gold attractive right now. The Equity Group Investments founder told Bloomberg Television this week that he was seeing inflation “all over the place.”
“You read about lumber prices, but we’re seeing it in all of our businesses,” Zell said. “The obvious bottlenecks in the supply chain arena are pushing up prices. It’s very reminiscent of the ‘70s.”
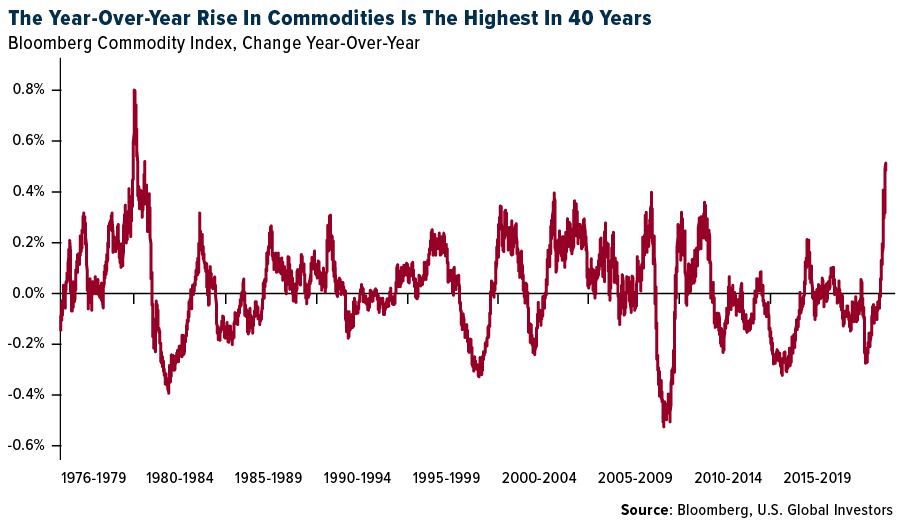
Commodities at Six-Year High, Copper at All-Time High
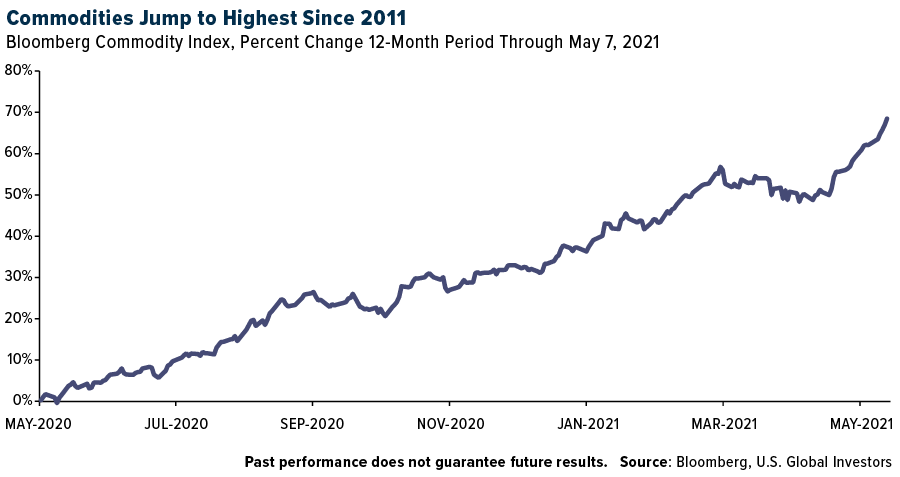
Indeed, one of the most obvious signs of inflation is rapidly expanding commodity prices, which rose to their highest since 2011 this week. For the 12-month period, the Bloomberg Commodity Index has returned close to 70%, one of the best runs for raw materials in recent memory. Meanwhile, copper, a bellwether of economic growth, touched a new record high of over $10,400 a metric ton.
I don’t see asset prices pulling back in the short term, given the ongoing risk of inflation and debasement of the U.S. dollar. Copper could very well be headed for $13,000 or more, so stay long.

Gold Market
This week spot gold closed at $1,831.24, up $62.11 per ounce, or 3.51%. Gold stocks, as measured by the NYSE Arca Gold Miners Index, ended the week higher by 8.73%. The S&P/TSX Venture Index came in flat at -0.03%. The U.S. Trade-Weighted Dollar fell 1.15%.
| Date | Event | Survey | Actual | Prior |
|---|---|---|---|---|
| May-3 | ISM Manufacturing | 65.0 | 60.7 | 64.7 |
| May-4 | Durable Goods Orders | 0.5% | 0.8% | 0.5% |
| May-5 | ADP Employment Change | 850k | 742k | 565k |
| May-6 | Initial Jobless Claims | 538k | 498k | 590k |
| May-7 | Change in Nonfarm Payrolls | 1,000k | 266k | 770k |
| May-11 | ZEW Survey Expectations | 72.0 | — | 70.7 |
| May-11 | ZEW Survey Current Situation | -41.6 | — | -48.8 |
| May-12 | Germany CPI YoY | 2.0% | — | 2.0% |
| May-13 | Initial Jobless Claims | 500k | — | 498k |
| May-13 | PPI Final Demand YoY | 5.8% | — | 4.2% |
Strengths
- The best performing precious metal for the week was silver, up 5.91%. Silver continues to do well due to the improving U.S. economy, which is strengthening the dollar. Reports showing a slowdown in manufacturing activity, along with disappointing jobs numbers, are also positive, as it implies that rates will remain low, which is good for silver. Palladium continues to do well and hit a 52-week high of $3,010.68 per troy ounce this week. Prices are up 23% year-to-date and are being driven by improved demand from catalytic converters.
- OceanaGold’s share price rose nearly 20% on the addition of Michael (Mick) McMullen and Paul Benson to the company’s Board of Directors. Both McMullen and Benson are highly respected in the mining industry and have relevant jurisdictional backgrounds that should help OceanaGold navigate its future.
- Franco-Nevada reported earnings surprise this week, $0.84 versus the $0.80 consensus. Revenues were 67% higher than forecasts, which is due to strong results from the Canadian Hemlo mine. Revenues from the mine were $21 million, higher than the $8 million consensus.
Weaknesses
- The worst performing precious metal for the week was palladium, down 0.60% after hitting an all-time high last week. The U.S. Mint’s sales of American Eagle gold coins totaled 38,500 ounces in April, a 63% decline year-over-year. This drop may be an inflection point, as January to April year-to-date sales rose 39% to 450,500 ounces.
- Centerra Gold share price traded down as much as 30% as the company updated the market on political developments in the Kyrgyz Republic, potentially impacting its ownership of the Kumtor mine. Political shocks like this are not uncommon regarding the ownership of Kumtor and can be painful short-term. The Kyrgyz government is the largest shareholder of Centerra, owning 26% of the company. Historically, these challenges can often turn into buying opportunities, although nothing is guaranteed.
- IAMGOLD, Argonaut Gold and Equinox all had earnings disappointments due to higher-than-expected costs along with a falling gold price during the quarter, which did not help. COVID-related issues have likely pushed operation efficiencies lower for many of the miners. Their operations are often in more remote regions of the world and it is known that vaccination rates are running much higher in developed regions.
Opportunities
- Gold began to advance after last week’s decline as seen in the chart below. Treasury Secretary Janet Yellen said President Biden’s plan would not increase inflationary pressures because the boost to demand would be spread out over a decade. This would enable central banks to continue dovish monetary policies, which would allow gold to appreciate. Additionally, the recently announced disappointing jobs number may encourage the Fed to remain dovish. Billionaire investor Sam Zell is also now buying gold, despite decades of criticizing those who purchase it, reports ETF Trends. Zell says it is because these monetary policies may create inflation like the 1970s and gold could be a hedge.
- Gold Bull observed visible gold in drill chips from drill holes outside a known resource in Sandman, Nevada. Gold Bull’s core asset is the Sandman Project and assays from these drill holes are expected by mid-May. CEO Cherie Leeden said it is rare to see visible gold in drill chips.
- Roscan Gold announced high grade and consistent drill results for 42 additional holes at the Kabaya location. The increased depth and volume of these drill results indicates that there may be a significant increase in production. Estimates are that it may be up to 1.5 million ounces higher than before.
Threats
- B2Gold reported a feasibility study with materially weaker economics for its Gramalote project. Reserve grades were lower than expected, which could bring production down from 417,000 ounces to 347,000 ounces. B2Gold may also do a revised feasibility study, which could delay the project up to one year. There are likely more accretive uses for B2Gold’s capital, which currently has better visibility toward meaningful growth.
- Inflation is increasing mine costs. Higher construction material costs (steel, copper, and timber, for example) are being seen. A depreciating U.S. dollar is increasing Canadian dollar cost exposure as well, as the Canadian dollar appreciates.
- Investment trends in the gold industry are making it more difficult for gold companies to grow. Shareholders are demanding a high percentage of earnings and divestment proceeds. Miners must navigate tricky jurisdictions and geologies as well as gain the trust of politicians and populations at a time of rising environmental standards. Host nations are also demanding a bigger slice of any mining windfalls. Those management teams that best understand how to obtain their social license will likely prosper more.

Index Summary
- The major market indices finished mixed this week. The Dow Jones Industrial Average gained 2.67%. The S&P 500 Stock Index rose 1.23%, while the Nasdaq Composite fell 1.51%. The Russell 2000 small capitalization index rose 0.23% this week.
- The Hang Seng Composite lost 1.11% this week; while Taiwan was down 1.60% and the KOSPI rose 1.57%.
- The 10-year Treasury bond yield fell 5 basis points to 1.573%.
Blockchain and Digital Currencies
Strengths
- Of the cryptocurrencies tracked by CoinMarketCap, the best performer for the week was Telcoin, rising 347.46%.
- Ether, the native token on the Ethereum blockchain, rallied to an all-time high of $3,607.74, gaining more than 370% since the beginning of the year. This week’s rally in altcoins (cryptocurrencies other than Bitcoin) saw an increase of around 10% in total market capitalization of cryptocurrencies. Dogecoin, the widely loved memecoin, also set a record high of $0.6953 per token, and is up approximately 12,700% year-to-date.

- Nokia announced the launch of its blockchain-based marketplace, named the Nokia Data Marketplace. According to the company’s press release, the goal of this service is to provide enterprises and communication service providers (CSPs) with the ability to access trusted datasets and improve business decision making. The service also allows enterprises and CSPs to become data marketplace providers through monetization of data swaps between customers or business participants. Additionally, Nokia is planning on deploying another platform geared toward advancing artificial intelligence and machine learning via blockchain-based federated learning protocols.
Weaknesses
- Of the cryptocurrencies tracked by CoinMarketCap, the worst performing for the week was PancakeSwap, down 10.61%.
- Coinbase Global Inc.’s shares dropped to fresh lows this week, shedding more than 50% of the $100 billion valuation it reached when it started trading on April 14. Analysts at FBB Capital Partners believe that the selloff experienced by Coinbase was largely due to the formation of a frothy marketplace, which has seen SPACs, cryptocurrencies, clean-tech, and hyper-growth stocks rally, that is now in the process of bursting.
- New York’s Attorney General (NYAG) has filed a court motion to shut down automated crypto trading app Coinseed, alleging continued fraud. In February, NYAG accused the app of defrauding its users out of $1 million through hidden fees, false claims, and a flopped token. Additionally, the U.S. Securities and Exchange Commission (SEC) filed a parallel lawsuit against Coinseed alleging token registration violations. Users of the app reported that their crypto balances were converted into Dogecoin without their consent, with one user claiming that his $48,000 position was reduced to $31,000 due to Dogecoin’s excessive volatility.
Opportunities
- Visa announced that it is partnering with California-based fintech startup, Tala, to drive cryptocurrency adoption for underbanked customers in emerging markets. According to the press release, the companies will collaborate with USD coin (USDC) operator Circle and the Stellar Development Foundation, and Tala will provide access to the U.S. dollar-backed stablecoin to its customers via its digital wallet. Tala, founded in 2011, has provided over $2 billion in credit to over 6 million customers in countries like India, Kenya, the Philippines, and Mexico in the form of micro-loans.
- VanEck, the New York-based investment manager, announced the launch of its thematic ETF in Europe that provides investors exposure to companies in cryptocurrency and the blockchain ecosystem. Trading under the ticker “DAPP”, the VanEck Vectors Digital Assets Equity UCITS ETF is listed on the London Stock Exchange and the Deutsche Boerse and has a total expense ratio of 0.65%.
- Goldman Sachs announced that it is offering investors access to Bitcoin-tied non-deliverable forwards (NDFs), which counterparties settle by exchanging the difference between the negotiated NDF rate and the spot rate of Bitcoin on a notional agreed sum. Goldman Sachs will hedge the risk of price volatility by trading Bitcoin futures in blocks through the CME Group.
Threats
- South Korea’s financial regulators have requested the nation’s banks to provide information on their dealings with cryptocurrency exchanges. The Financial Services Commission (FSC) announced during the last week of April that a revision in South Korea’s Act on Reporting and Using Specified Financial Transaction Information requires cryptocurrency exchanges to implement real-name accounts for their customers or risk facing up to five years in prison. So far, only four of the nation’s largest exchanges have set up real-name accounts, and estimates suggest that there are around 100-200 cryptocurrency exchanges operating outside the purview of the government.
- New York legislatures will debate a new bill that seeks to place a three-year moratorium on crypto mining operations pending an environmental review by the state. If the bill is passed, it will allow state inspectors to assess the impact of mining facilities on water and air quality, carbon emissions and wildlife, and would lift the moratorium only for mining facilities that will not adversely affect New York’s goal to slash its greenhouse gas emissions 70% by 2030.
- The Central Bank of Iran (CBI) has reportedly banned trading of cryptocurrencies mined outside the country. The ban, according to people familiar with the matter, is an attempt to thwart capital outflows from the country which could be attributed to its depreciating national currency, the rial. Iran had already banned cryptocurrency payments, while the nation’s financial institutions can only use cryptocurrencies which are derived from sanctioned miners.
Domestic Economy and Equities

Strengths
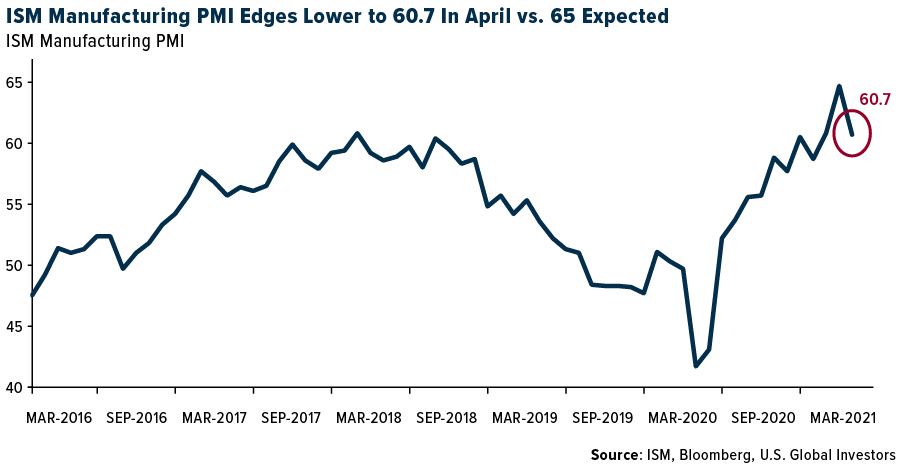
- Economic activity in the U.S. manufacturing sector continued to grow at a strong pace in April with the ISM manufacturing PMI arriving at 60.7. The reading came in weaker than the 37-year-high set in March, however, and missed the market expectation of 65.
- Taxable municipal bonds rebounded in April outpacing their tax-exempt counterparts by the widest margin in nine months. There have been records of inflows into muni mutual funds with U.S. President Joe Biden recommending tax increases for the higher earners.
- Baker Hughes Corporation, an oilfield products and services company, was the best performing S&P 500 stock for the week, increasing 23%. Shares of Baker Hughes gained on news that U.S. energy firms added oil and natural gas rigs for a second week in a row, as higher oil prices prompted some drillers to increase production. The oil and gas rig count rose to 448 in the week to May 7, reaching its highest since April 2020.
Weaknesses
- April nonfarm employment posted a big miss, increasing only by 266,000 versus the expected 1 million. Many economists were expecting an even higher jobs number amid signs that the U.S. economy was coming back to life.
- The unemployment rate slightly increased to 6.1% in April from 6% in March. Bloomberg economists expected the unemployment rate to drop to 5.8%.
- Etsy Inc., an e-commerce website servicing customers in the United States, was the worst performing S&P 500 stock for the week, decreasing 17%. Shares declined after the company announced its latest results and provided a lighter growth outlook. Etsy shares declined 15% on Thursday, but Stifel upgraded the company to a buy from a hold on Friday after the prior day’s post-earnings slump.
Opportunities
- Fiscal stimulus continues to generate a lot of headlines ahead of bipartisan talks next week. President Biden reiterated multiple times this week that he is willing to compromise on the White House’s 28% corporate tax rate proposal. However, he also said stimulus must be offset by raising revenue. Moderate Democrats seem to be focusing on a 25% rate.
- UBS economists forecast very strong consumption growth in 2021. Its research team expects the following categories to benefit from the increased spending: groceries and health related products along with housing and home improvement.
- Eighty-eight percent of the S&P 500’s market cap has reported first quarter results. Earnings have surpassed estimates by 22% in aggregate, with 86% of companies topping projections, according to Credit Suisse. The focus now shifts to the second quarter. Consensus earnings per share forecasts for the next quarter have risen by 5% versus robust first-quarter beats of 22%.
Threats
- Sell-side strategists have been more cautious as of late with some of the focus on peak growth signals. Goldman Sachs highlighted expectations for the pace of U.S. economic growth to peak over the next one to two months and noted this dynamic usually leads to weaker equity returns and greater volatility.
- Gary Gensler, Securities and Exchange Commission chairman, pledged Thursday to increased regulation that will prevent large price swings in shares of GameStop Corp. He also vowed to look at new rules for cryptocurrencies, corporate disclosures tied to climate risks and the derivatives that triggered the blow-up of Archegos Capital Management, Bill Hwang’s family office.
- Treasury Secretary Janet Yellen, during an economic seminar presented by The Atlantic on Tuesday, said rates may need to rise modestly to keep the economy from overheating. The U.S. economy has been on fire, with first-quarter GDP growth at 6.4%. Goldman Sachs recently said it anticipates the second quarter growing around 10.5%.
Energy and Natural Resources Market
Strengths
- The best performing commodity for the week was lumber, up 21.36%. U.S. lumber futures extended their rally to fresh record highs, rising above $1,500 as sawmills try to keep up with surging demand.
- Copper rallied to 10-year highs, with futures on the London Metals Exchange settling as high as $10,386 a tonne this week. The metal’s rally is buoyed by the crucial role it is expected to play in the green-energy transition in the long-term, while stimulus measures and vaccine rollouts are fueling resurgence in short-term demand which might strain supply. Big banks and commodities traders, including Trafigura Group, believe that there is more room in the current copper rally, with Trafigura setting a price target of $15,000 a ton within the decade.
- Oil extended its rally to settle with two consecutive weeks of gains as investors bet on rising energy demand amidst a broader rally in commodities. Although West Texas Intermediate (WTI) futures slid on Friday on the back of U.S. jobs data missing expectations by almost 80%, it finished with a 1.97% gain this week, marking its first back-to-back weekly increase since early March. There are still concerns over demand recovery as COVID-19 continues to spread throughout the world, particularly in key crude importer India. OPEC+ is confident that the market can absorb extra production as member nations gradually restore supply that was halted when the pandemic struck last year. The chart below showcases the dramatic rally in commodities since the pandemic began, pushing year-over-year change in commodity prices to the highest levels in 40 years.
Weaknesses
- The worst performing commodity for the week was coal, down 0.41%. This week’s decline in coal can be attributed to Colombian miner’s blocking railways and roads servicing the nation’s biggest coal mine, and Citigroup, along with Trafigura Group and Resource Capital Funds, proposing a “Coal to Zero” venture which plans to buy mines and operate them for profit, before shutting down operations in 2045.
- According to research done by a New-York based climate research group, Rhodium Group, China’s emissions of greenhouse gases like methane, carbon dioxide and nitrous oxide rose to 14.09 billion tons of CO2 equivalent in 2019, accounting for more emissions than all the world’s developed nations combined. China was responsible for 27% of global emissions, followed by the U.S. and India, which contributed 11% and 6.6% respectively. These figures highlight the dire need of President Xi Jinping’s ambition of peaking carbon emissions before 2030 and reaching net-zero by 2060.
- Italy-based Enel SpA, the largest utilities provider in Europe, came under scrutiny for its business strategy after it reported its first quarter results and guidance, which failed to bolster investor confidence in the company’s long-term growth. Analysts from Citigroup and Morgan Stanley questioned the company’s ability to achieve its financial targets after reporting declines in earnings and revenue. Citigroup has a sell recommendation on Enel and said that the company’s stake sale in an Italian telecommunication firm will “only formally” allow Enel to meet this year’s earnings outlook. Citigroup’s analysts added that Enel would have to come up a new growth strategy, based on diversification and acquisition, and amend how it communicates its goals in a bid to regain investor confidence.
Opportunities
- Royal Dutch Shell Plc announced that it plans on starting operations at a green hydrogen plan at its main refinery in Germany in July. The company’s Rheinland Plant is set to become Europe’s first refinery to start green hydrogen production on-site. Shell added that it will use the hydrogen in production processes at the refinery, as well as supply it for usage in cars and trucks. Produced by sending electricity through water, green hydrogen is a key part of strategies developed by the European Union, governments, utility providers and other energy stakeholders to help cut emissions. The company is also planning a green hydrogen project in the Netherlands, and already has a network of refueling stations in Germany and California.
- The U.S. government expects jet fuel demand to surge by 30% compared to the first quarter, as airlines revamp routes to offer more nonstop flights and boost capacity to reach more leisure destinations to serve the pent-up demand. The initial return of demand for flights just meant that planes were filling up again, but now additional flights are being added to schedules as U.S departures in March were being added at almost a dozen new flights per day, especially to Denver and Las Vegas. The U.S. Department of Transportation reported that U.S. airlines in March user 33% more fuel that in February, setting the highest monthly consumption since March 2020. Currently, domestic leisure travel is nearing back to 2019 levels for many airlines while business traffic remains 80% below pre-pandemic levels.
- Germany’s ruling coalition announced this week that it will aim to eliminate greenhouse gas emissions by 2045, five years before its previous goal and the shortest timeline amongst major economies throughout the world. U.K. based Energy & Climate Intelligence Unit said that Germany’s renewed climate pledge will help other European countries accelerate their net zero goal timeline, citing the nation’s past leadership and investments in solar energy during the early 2000s, which helped make the renewable source cheaper around the world. To achieve this goal, Germany will have to double its pace of emissions cuts to 30 million tons annually over the next 25 years and phase out coal power generation by 2030, instead of its 2038 target. Additionally, the country will have to increase its electric vehicles target from 10 million, by the end of the decade, to 14 million. In a bid to finance this transformation, Germany’s Economy Minister is proposing that the nation should establish a private fund, which will be able to take on debt without it showing on the federal government’s accounts and breaching constitutional limits on borrowing.
Threats
- The International Energy Agency (IEA) is recommending western governments that they should consider stockpiling critical raw materials for batteries such as cobalt and lithium, warning that geopolitical risks could adversely affect the world’s green-energy transition. This recommendation comes on the back of commodities’ prices rallying to new highs, and production and processing of rare earth elements being highly concentrated, with the top three producers accounting for more than 75% of global supply. The U.S. Department of Energy reported earlier this year that the nation lacks sufficient domestic resources to meet projected demand for critical raw materials and recommended that the government should partner with allies to build supply chains and develop substitutes.
- Chile’s lower house approved a bill proposing progressive tax rate on copper sales which, if passed by the senate, could be one of the heaviest tax burdens in global mining and stall investments in the nation. The bill adds marginal rates starting at 15% on sales derived from copper prices between $2 and $2.50 per pound and almost 75% when prices exceed $4 per pound, giving it an effective rate of 21.5%.
- U.S. food supply-chains are experiencing disruption from rising costs of recycled paper and corn, which are essential for making packaging materials. The cost of containerboard needed to produce corrugated boxes, which are used for shipping pizza and perishable food, has risen as much as 17% since November, with analysts calling it a dramatic rally as this market usually does not fluctuate this much. Demand for packaging materials is pushing big paper companies to run their machines at near capacity and is leading to major backlogs, raising the risk of emptier-than-usual grocery shelves. President and founder of the U.S.’s biggest pasture-raised and free-range egg producer reported that the company is waiting as many as 12 to 16 weeks for new cartons, compared to the usual 4 to 6 weeks. NielsenIQ, a provider of data regarding consumer behavior, reported that seafood prices are up 18.7% on average in the three-month period ending April 24, and that cost of baked goods like donuts is up 7.5% compared to the same period last year. Moreover, 50 of the 52 categories tracked by NielsenIQ are more expensive compared to last year, with only milk and butter staying flat.
Airline Sector
Strengths
- The best performing airline stock for the week was Norwegian Air Shuttle, up 38.3%. The airline’s 6 billion Norwegian kroner capital raising activity was oversubscribed, indicating strong investor interest. Alaska Air reported surprisingly strong earnings this week, that were 14% above consensus, with revenues 5% better than expected. Guidance for the second quarter increased 7%, with improved leisure demand driving this improvement. Management indicated that capacity would be at 2019 levels by late summer.
- Airline co-branded loyalty credit cards continue to be positive for the industry. Airlines will sell miles to credit card companies in exchange for cash. Delta and Alaska Air, for example, indicated that March spending was above 2019 levels using these cards. The higher the spending, the more frequent flier miles accrue, and the more cash is received by airlines – a win-win scenario.
- Website traffic continues to improve for U.S. airlines, and this bodes well for ticket sales. Recent data (as of April 28) shows that website visits were down only 11% versus 2019 levels. Hawaiian Air is up 32%, Southwest is up 11% and American Airlines is up 9% versus 2019 levels. Bookings are continuing to improve as well, and June bookings are now at 90% of 2019 levels.
Weaknesses
- The worst performing airline stock for the week was Cathay Pacific Air, down 5.0%. Allegiant reported first-quarter earnings of ($3.58) per share, below the ($3.10) consensus. Revenue was 6% below expectations, and capacity flown was 2% below expectations. Air Canada also reported earnings 3% below expectations and indicated that capacity was 84% below 2019 levels.
- Estimates are being cut for Turkish Airways in the next quarter due to low load factors. Capacity flown will be only 50-60% of the amount flown in 2019. The load factor will be equal to that in the first quarter (62%), reducing estimates for the second quarter by about 3%. Rising COVID cases in Turkey are impacting bookings for the airline as well.
- International capacity remains subdued as demand has yet to increase significantly. U.S. to Atlantic capacity is down 65% from the second quarter of 2019 to second quarter of 2021. U.S. to Pacific capacity is down 73% from the second quarter of 2019 to second quarter of 2021.
Opportunities
- Capacity is expected to return to U.S. airlines. According to Stifel, capacity is expected to be at 80% of 2019 levels in May, 87% in June and 93% in July. The added capacity includes previously parked aircraft that are being returned to service as demand improves.
- JetBlue may have significantly improved operations, potentially returning to pre-pandemic load factors by June. Costs have been reduced by $150-200 million and the company is also looking to adjust its co-branded credit card relationship. Should the carrier switch from Barclays to Goldman Sachs, it may be able to receive a signing fee that is amortized over the life of the new contract.
- Recent European developments may have a favorable impact on the airline industry. Specifically, Boris Johnson has said that travel restrictions may end June 21, and France has a timeline for reopening by June 30. The EU is also set to recommend that Americans with proof of vaccination can travel to Europe this summer. Lastly, Spain will also allow tourism in June with proof of vaccination.
Threats
- European airlines are seeing estimate reductions due to lockdowns and travel restrictions throughout Europe. Ryanair’s estimates, for example, were recently reduced by Raymond James. Wizz and EasyJet have indicated that there is unlikely to be any travel increase until late summer, which is reducing earnings estimates.
- Ryanair reported April traffic data that may imply that second-quarter earnings will be weak. Volume was down 93% versus two years ago while capacity was down 89% versus two years ago. Load factors were at 67%.
- Alitalia is running out of time to set up a new national carrier before the summer travel season. Talks with the European Commission about a planned restart are at a standstill due to a requirement that asset and personnel are separated for both the bankrupt airline and its replacement. Last year, the carrier paid employees only half of their salaries. The chart below shows that Alitalia has been lagging its peers in passenger count due to this restructuring. It has been losing market share to low-cost carriers.


Emerging Markets
Strengths
- The best performing country in emerging Europe for the week was Russia, gaining 6%. The best performing country in Asia this week was South Korea, gaining 2%.
- The Russian ruble was the best performing currency in emerging Europe this week, gaining 2.3%. The Indonesian rupee was the best performing currency in Asia this week, gaining 2.4%.
- Eurozone PMI data for April came out strong. Growth in the eurozone is now running at the second fastest level in over two-and-half-years and the best since last July. It is the first time in seven months that both manufacturing and services are expanding. Germany, Spain and France are the main growth drivers in Europe.
Weaknesses
- The worst relative performing country in emerging Europe for the week was Czech Republic, gaining 2.8%.The worst performing country in Asia this week was Taiwan, losing 1.8%.
- The Turkish lira was the worst relative performing currency in emerging Europe this week, gaining 75 basis points. The Malaysian ringgit was the worst performing currency in Asia, losing 57 basis points.
- India set a record for daily new COVID cases, with over 412,000 registered on Thursday alone. Data from India’s Health Ministry shows that total infections have surpassed 21 million as of Thursday and that the overall death toll climbed above 230,000, a tally that experts believe vastly underestimates the actual total.
Opportunities
- Poland ratified the European Union’s pandemic stimulus package after teaming up with Hungary in December to protest the EU’s efforts to distribute funds based on countries adherence to democratic rule of law. European members are getting closer to receiving the much-needed funds, totaling 800 billion euros ($961 billion). The package still needs approval of seven more of the bloc’s 27 members. Spain, Italy and France will be the top three beneficiaries on the package. Poland and Romania will receive the largest amount of funds among the members of central emerging Europe (CEE).
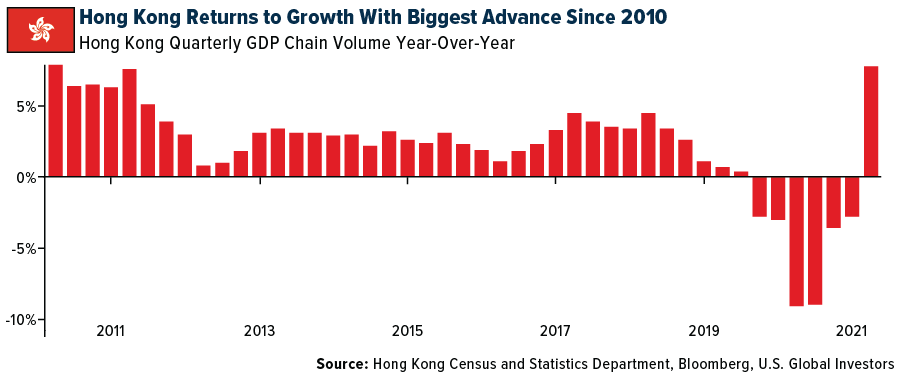
- Honk Kong’s economy has turned the corner. Gross domestic product surged 7.8% in the first quarter from a year earlier, beating all estimates in a Bloomberg survey of economists. The stronger-than-expected growth in the first quarter may point to a faster recovery. The government will announce its latest growth projections for the full year on May 14. Financial Secretary Paul Chan has previously estimated the economy will expand 3.5% to 5.5%.
- President Joe Biden said his team is working to schedule a meeting with Russian President Vladimir Putin during his visit to Europe next month. It will give both leaders the opportunity to discuss open maters face-to-face.
Threats
- Rumors this week came out that the Biden administration will likely maintain Trump’s investment bans on companies linked to China’s military, which includes three of the country’s biggest telecommunication firms. U.S. President Joe Biden is trying to work on U.S./China relations as tensions flare over issues ranging from trade to human rights. During the G7 meeting in London, members listed many ways the group is concerned with China. The list included human rights violations and the erosion of democracy in Hong Kong.
- Reuters reported that the eurozone is planning to cut dependency on China and other foreign suppliers in six strategic areas. The European Commission plans to perform an in-depth review of supply chains in raw materials, batteries, active pharmaceutical ingredients, hydrogen, semi-conductors, and cloud & edge technologies.
- China’s securities regulator is weighing tighter rules for companies seeking to list in Hong Kong or overseas, a move that could hit technology firms already hurting from months of clampdowns, according to people familiar with the matter. The China Securities Regulatory Commission is considering proposals that would require firms seeking initial public offerings outside mainland China to submit listing documents to ensure they’re compliant with local laws and regulations.
Leaders and Laggards
| Index | Close | Weekly Change($) |
Weekly Change(%) |
|---|---|---|---|
| 10-Yr Treasury Bond | 1.57 | -0.06 | -3.38% |
| Oil Futures | 64.83 | +1.25 | +1.97% |
| Hang Seng Composite Index | 4,474.59 | -50.04 | -1.11% |
| S&P Basic Materials | 551.57 | +30.52 | +5.86% |
| Korean KOSPI Index | 3,197.20 | +49.34 | +1.57% |
| S&P Energy | 404.65 | +33.05 | +8.89% |
| Nasdaq | 13,752.24 | -210.44 | -1.51% |
| DJIA | 34,777.76 | +902.91 | +2.67% |
| Russell 2000 | 2,271.63 | +5.18 | +0.23% |
| S&P 500 | 4,232.43 | +51.26 | +1.23% |
| Gold Futures | 1,832.70 | +65.00 | +3.68% |
| XAU | 156.28 | +14.15 | +9.96% |
| S&P/TSX VENTURE COMP IDX | 954.98 | -0.28 | -0.03% |
| S&P/TSX Global Gold Index | 316.37 | +21.76 | +7.39% |
| Natural Gas Futures | 2.96 | +0.03 | +0.96% |
| Index | Close | Monthly Change($) |
Monthly Change(%) |
|---|---|---|---|
| Korean KOSPI Index | 3,197.20 | +59.79 | +1.91% |
| 10-Yr Treasury Bond | 1.57 | -0.10 | -6.09% |
| Gold Futures | 1,832.70 | +91.10 | +5.23% |
| S&P Basic Materials | 551.57 | +53.85 | +10.82% |
| S&P 500 | 4,232.43 | +152.48 | +3.74% |
| DJIA | 34,777.76 | +1,331.50 | +3.98% |
| Nasdaq | 13,752.24 | +63.40 | +0.46% |
| Oil Futures | 64.83 | +5.06 | +8.47% |
| Hang Seng Composite Index | 4,474.59 | -52.52 | -1.16% |
| S&P/TSX Global Gold Index | 316.37 | +18.15 | +6.09% |
| XAU | 156.28 | +15.61 | +11.10% |
| Russell 2000 | 2,271.63 | +48.58 | +2.19% |
| S&P Energy | 404.65 | +33.42 | +9.00% |
| S&P/TSX VENTURE COMP IDX | 954.98 | -0.11 | -0.01% |
| Natural Gas Futures | 2.96 | +0.44 | +17.42% |
| Index | Close | Quarterly Change($) |
Quarterly Change(%) |
|---|---|---|---|
| XAU | 156.28 | +18.77 | +13.65% |
| S&P/TSX Global Gold Index | 316.37 | +15.86 | +5.28% |
| Gold Futures | 1,832.70 | +38.90 | +2.17% |
| DJIA | 34,777.76 | +3,721.90 | +11.98% |
| S&P 500 | 4,232.43 | +360.69 | +9.32% |
| Nasdaq | 13,752.24 | -25.50 | -0.19% |
| Korean KOSPI Index | 3,197.20 | +109.65 | +3.55% |
| Natural Gas Futures | 2.96 | +0.02 | +0.82% |
| S&P Basic Materials | 551.57 | +97.24 | +21.40% |
| Russell 2000 | 2,271.63 | +69.21 | +3.14% |
| Oil Futures | 64.83 | +8.60 | +15.29% |
| Hang Seng Composite Index | 4,474.59 | -227.62 | -4.84% |
| S&P/TSX VENTURE COMP IDX | 954.98 | -43.16 | -4.32% |
| S&P Energy | 404.65 | +86.49 | +27.18% |
| 10-Yr Treasury Bond | 1.57 | +0.43 | +37.86% |
U.S. Global Investors, Inc. is an investment adviser registered with the Securities and Exchange Commission ("SEC"). This does not mean that we are sponsored, recommended, or approved by the SEC, or that our abilities or qualifications in any respect have been passed upon by the SEC or any officer of the SEC.
This commentary should not be considered a solicitation or offering of any investment product.
Certain materials in this commentary may contain dated information. The information provided was current at the time of publication.
Some links above may be directed to third-party websites. U.S. Global Investors does not endorse all information supplied by these websites and is not responsible for their content.
Holdings may change daily. Holdings are reported as of the most recent quarter-end. The following securities mentioned in the article were held by one or more accounts managed by U.S. Global Investors as of (03/31/2021):
Alaska Air Group Inc.
American Airlines Group
Alaska Air Group Inc.
Delta Air Lines Inc.
Sun Country Airlines
Allegiant Travel Co.
Air Canada
Turkish Airways
JetBlue Airways Corp.
Wizz Air Holdings Plc
OceanaGold Corp
Franco-Nevada
Centerra Gold
IAMGOLD Corp
Argonaut Gold Inc.
Roscan Gold Corp
Gold Bull Resources
B2Gold Corp
*The above-mentioned indices are not total returns. These returns reflect simple appreciation only and do not reflect dividend reinvestment. The Dow Jones Industrial Average is a price-weighted average of 30 blue chip stocks that are generally leaders in their industry. The S&P 500 Stock Index is a widely recognized capitalization-weighted index of 500 common stock prices in U.S. companies. The Nasdaq Composite Index is a capitalization-weighted index of all Nasdaq National Market and SmallCap stocks. The Russell 2000 Index® is a U.S. equity index measuring the performance of the 2,000 smallest companies in the Russell 3000®, a widely recognized small-cap index. The Hang Seng Composite Index is a market capitalization-weighted index that comprises the top 200 companies listed on Stock Exchange of Hong Kong, based on average market cap for the 12 months. The Taiwan Stock Exchange Index is a capitalization-weighted index of all listed common shares traded on the Taiwan Stock Exchange. The Korea Stock Price Index is a capitalization-weighted index of all common shares and preferred shares on the Korean Stock Exchanges. The Philadelphia Stock Exchange Gold and Silver Index (XAU) is a capitalization-weighted index that includes the leading companies involved in the mining of gold and silver. The U.S. Trade Weighted Dollar Index provides a general indication of the international value of the U.S. dollar. The S&P/TSX Canadian Gold Capped Sector Index is a modified capitalization-weighted index, whose equity weights are capped 25 percent and index constituents are derived from a subset stock pool of S&P/TSX Composite Index stocks. The S&P 500 Energy Index is a capitalization-weighted index that tracks the companies in the energy sector as a subset of the S&P 500. The S&P 500 Materials Index is a capitalization-weighted index that tracks the companies in the material sector as a subset of the S&P 500. The S&P 500 Financials Index is a capitalization-weighted index. The index was developed with a base level of 10 for the 1941-43 base period. The S&P 500 Industrials Index is a Materials Index is a capitalization-weighted index that tracks the companies in the industrial sector as a subset of the S&P 500. The S&P 500 Consumer Discretionary Index is a capitalization-weighted index that tracks the companies in the consumer discretionary sector as a subset of the S&P 500. The S&P 500 Information Technology Index is a capitalization-weighted index that tracks the companies in the information technology sector as a subset of the S&P 500. The S&P 500 Consumer Staples Index is a Materials Index is a capitalization-weighted index that tracks the companies in the consumer staples sector as a subset of the S&P 500. The S&P 500 Utilities Index is a capitalization-weighted index that tracks the companies in the utilities sector as a subset of the S&P 500. The S&P 500 Healthcare Index is a capitalization-weighted index that tracks the companies in the healthcare sector as a subset of the S&P 500. The S&P 500 Telecom Index is a Materials Index is a capitalization-weighted index that tracks the companies in the telecom sector as a subset of the S&P 500. The NYSE Arca Gold Miners Index is a modified market capitalization weighted index comprised of publicly traded companies involved primarily in the mining for gold and silver. The Consumer Price Index (CPI) is one of the most widely recognized price measures for tracking the price of a market basket of goods and services purchased by individuals. The weights of components are based on consumer spending patterns. The Purchasing Manager’s Index is an indicator of the economic health of the manufacturing sector. The PMI index is based on five major indicators: new orders, inventory levels, production, supplier deliveries and the employment environment. The S&P/TSX Venture Composite Index is a broad market indicator for the Canadian venture capital market. The index is market capitalization weighted and, at its inception, included 531 companies. A quarterly revision process is used to remove companies that comprise less than 0.05% of the weight of the index, and add companies whose weight, when included, will be greater than 0.05% of the index. Gross domestic product (GDP) is the monetary value of all the finished goods and services produced within a country’s borders in a specific time period, though GDP is usually calculated on an annual basis. It includes all of private and public consumption, government outlays, investments and exports less imports that occur within a defined territory.
The Bloomberg Commodity Index is made up of 22 exchange-traded futures on physical commodities. The index represents 20 commodities, which are weighted to account for economic significance and market liquidity.
Frank Holmes has been appointed non-executive chairman of the Board of Directors of HIVE Blockchain Technologies. Mr. Holmes owns shares of HIVE while U.S. Global Investors owns convertible securities. Effective 8/31/2018, Frank Holmes serves as the interim executive chairman of HIVE.

