


Nontraditional Funds Took the Stage at World’s Biggest ETF Conference
Date Posted: January 31, 2020
Read time: 53 min
Two topics seemed to dominate at the 2020 Inside ETFs conference: the rise of ESG investing, and the emergence of so-called "nontransparent" ETFs. Both promise some big changes to financial markets.
By Frank Holmes
CEO and Chief Investment Officer
U.S. Global Investors

When Derek Jeter speaks, people listen. After all, the former Yankees shortstop’s talents and successes, on and off the field, seem otherworldly.
Drafted straight out of high school in 1992, Jeter went on to become the first ever Yankee to record 3,000 hits—an achievement reached by only 27 other players in baseball history. He also holds records in doubles and stolen bases.
The five-time World Series champion was recently inducted into the National Baseball Hall of Fame—in his first year of eligibility, no less—and when casting their votes, the Baseball Writers’ Association of America (BBWAA) gave Jeter the second-highest plurality in the group’s 112-year history.
Jeter stopped by at this year’s Inside ETFs in Hollywood, Florida, drawing larger crowds of attendees than any other speaker at the four-day conference. He answered questions on a wide range of topics, from the recent tragic death of NBA star Kobe Bryant—“he was such a great family man,” Jeter lamented—to his move to the front office with the Miami Marlins.
Two of his comments in particular stuck with me.
“I play to win,” he said, “and anyone who claims they do otherwise is lying.”
I’m confident everyone reading this right now feels the same level of competitiveness when investing. There’s no greater feeling than to win in the financial markets—and the reverse is also true. That brings me to the second thing:
“Every time you take the field is a new opportunity.”
One of the great certainties of life is that we all have the same 1,440 minutes in a day. If one day comes up short of your expectations, tomorrow will inevitably bring you a whole new set of opportunities. That’s the case not just in investing but also in our careers, outside interests, friendships and romances.
For now, though, let’s focus on investing—particularly ETFs.
Top Two ETF Trends to Watch: ESG and Nontransparent
U.S.-based ETFs had a red-hot 2019, ending the year with $4.4 trillion in assets, a 30 percent increase from 2018.
Even bigger changes could be headed our way, if some of the discussions at this year’s Inside ETFs are any indication. Two topics seemed to dominate the conference: the rise of ESG investing, and the emergence of so-called “nontransparent” ETFs.
I’ve talked before about ESG—or “environmental, social and corporate governance.” Such ETFs strategically limit their exposure to companies that produce lots of carbon, for example, while boosting those that may have greater diversity on their boards and in the C-suite.
For many years now, ESG has been a niche focus, seeing muted flows by only the most “green”-minded investors. A tipping point seems to have occurred in 2019, though, with net flows into open-end and exchange-traded ESG funds topping $20.6 billion, according to Morningstar data. That’s four times the amount that such funds attracted the previous year. ESG appears to have gone mainstream.
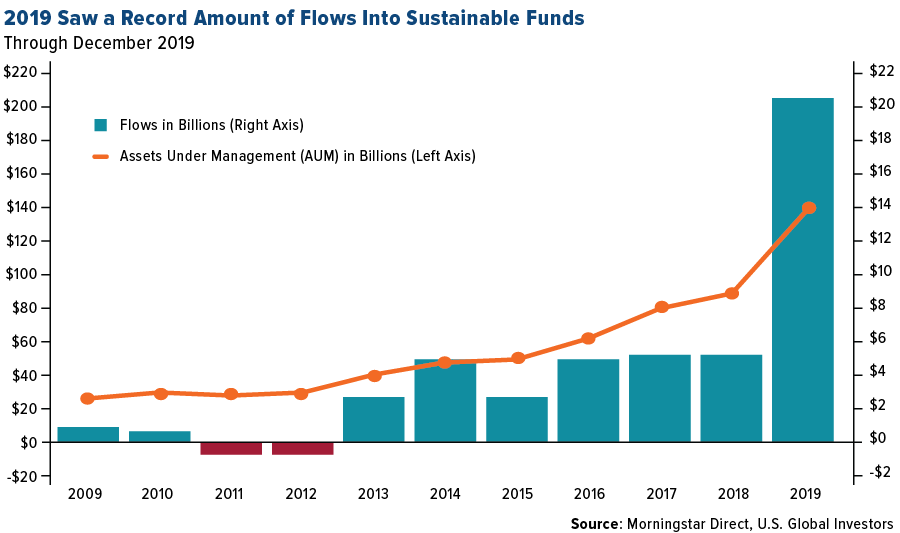
And yet this may only be the beginning. A January survey conducted by the deVere Group found that a whopping eight out of 10 millennial investors around the globe cited ESG as a top priority when considering investment opportunities, trumping even anticipated returns and past performance. Millennials are now the largest living generation, having surpassed baby boomers, so this change in investor appetite is expected to transform world markets.
As for nontransparent ETFs, these are a new-ish breed of funds that take the best from both mutual funds and ETFs and combine them into one 40 Act investment vehicle. Also called “semitransparent” ETFs or “exchange-traded managed funds (ETMFs),” these lower-cost products can be traded throughout the day on an exchange like typical ETFs. They also have all of their tax efficiency. Where they differ from ETFs, however, is they don’t have to disclose all of their positions and weightings on a daily basis—hence, “nontransparent.” Such a structure will allow active managers to tap into the popular ETF market without having to give away their intellectual property (IP).
Like ESG strategies, nontransparent funds are among the fastest growing segments of the ETF industry. Expect to read more about them in the coming weeks and months.
Bullish on Domestic Equities? Proceed With Caution
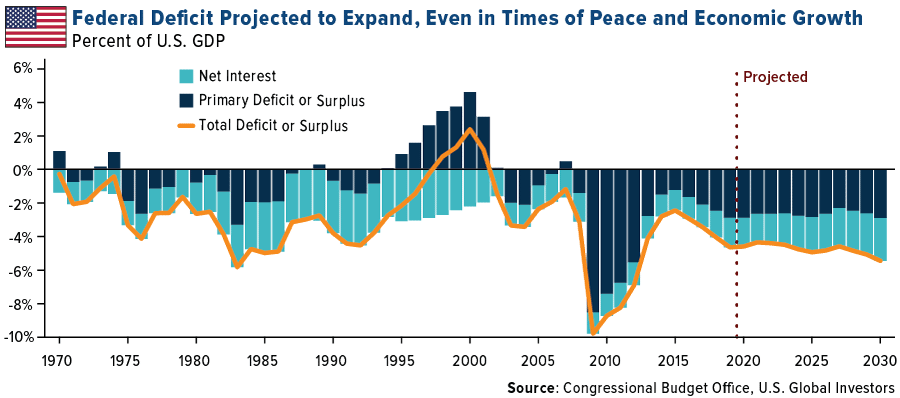
Also top of mind among several presenters was the longevity of the U.S. stock bull market. One of the biggest long-term risks continues to be runaway federal spending. The Congressional Budget Office (CBO) this week released its projection that the federal deficit—or the difference between tax revenues and spending—will exceed $1 trillion in 2020 and all subsequent years if nothing changes. That’s unprecedented in times of peace and economic growth. It also threatens to curb additional expansion, as debt service will increasingly grow as a percent of federal expenditures, siphoning away funds that could instead be spent on infrastructure, defense and more.
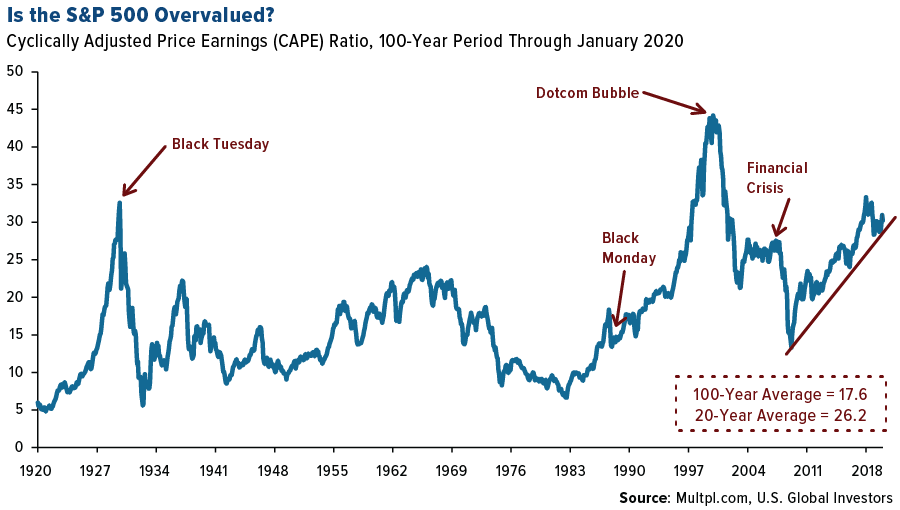
As was pointed out numerous times during the conference, the S&P 500 Index is looking highly overvalued right now, with a cyclically adjusted price-to-earnings (CAPE) ratio of above 31 times earnings in January. That’s well above the 100-year average of 17.6 times earnings and 20-year average of 26.2 times earnings. It also puts valuations in a similarly elevated range as when stocks collapsed in 1929 and during the dotcom bubble of 1999-2000.
So what can investors do? In short, make sure you’re diversified, particularly in emerging markets (EM), Treasury bills and hard assets such as gold, precious metals and real estate.
That was the advice of Larry Swedroe, chief research officer of Buckingham Strategic Wealth and author of Your Complete Guide to a Successful and Secure Retirement,released just last year.
Granted, staying diversified is sometimes easier said than done, especially when the stock market has regularly been hitting new all-time highs—that is, before coronavirus fears began rattling investors. To illustrate his point, Swedroe shared with us a quote by portfolio manager James Gipson that I think many of you will find a lot of humor (and truth!) in:
“Diversification for investors, like celibacy for teenagers, is a concept both easy to understand and hard to practice.”
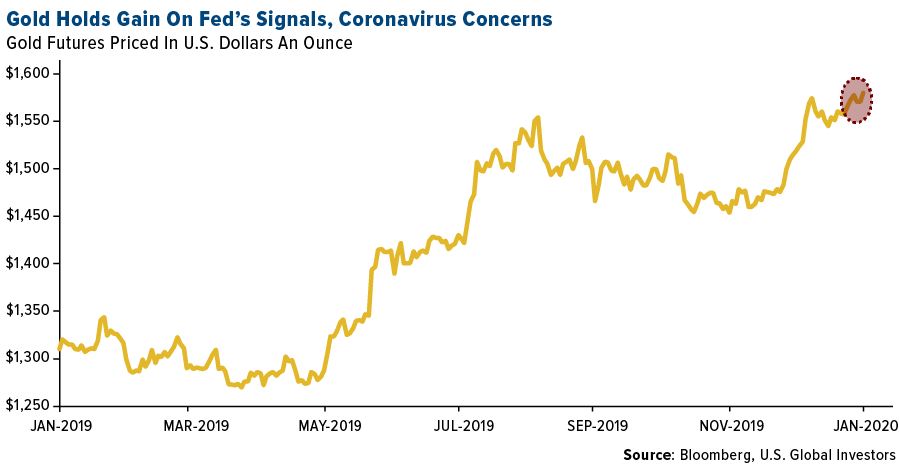
Negative-Yielding Debt Rises to $13 Trillion
Speaking of gold, the yellow metal ended the week up on market volatility and has now increased more than 4 percent so far in the new year. The pool of global government bonds trading with a negative yield rose $1.16 trillion last week to top approximately $13 trillion. That’s still below the record amount of $17 trillion, last seen in August of last year, but it’s just one of several risk factors investors should keep their eyes on.
Is now the time to invest in precious metals? Watch my recent interview from the sidelines of the Vancouver Resource Investment Conference (VRIC) by clicking here!

Gold Market
This week spot gold closed at $1,589.16, up $17.63 per ounce, or 1.12 percent. Gold stocks, as measured by the NYSE Arca Gold Miners Index, ended the week lower by 0.80 percent. The S&P/TSX Venture Index came in off 1.13 percent. The U.S. Trade-Weighted Dollar fell 0.50 percent.
| Date | Event | Survey | Actual | Prior |
|---|---|---|---|---|
| Jan-27 | New Homes Sales | 730k | 694k | 697k |
| Jan-28 | Durable Goods Orders | 0.3% | 2.4% | -3.1% |
| Jan-28 | Conf. Board Consumer Confidence | 128.0 | 131.6 | 128.2 |
| Jan-29 | FOMC Rate Decision (Upper Bound) | 1.75% | 1.75% | 1.75% |
| Jan-30 | Hong Kong Exports YoY | 2.7% | 3.3% | -1.4% |
| Jan-30 | Germany CPI YoY | 1.7% | 1.7% | 1.5% |
| Jan-30 | GDP Annualized QoQ | 2.0% | 2.1% | 2.1% |
| Jan-30 | Initial Jobless Claims | 215k | 216k | 223k |
| Jan-31 | Eurozone CPI Core YoY | 1.2% | 1.1% | 1.3% |
| Feb-2 | Caixin China PMI Mfg | 51.0 | — | 51.5 |
| Feb-3 | ISM Manufacturing | 48.4 | — | 47.2 |
| Feb-4 | Durable Goods Orders | 2.3% | — | 2.4% |
| Feb-5 | ADP Employment Change | 150k | — | 202k |
| Feb-6 | Initial Jobless Claims | 215k | — | 216k |
| Feb-7 | Change in Nonfarm Payrolls | 160k | — | 145k |
Strengths
- The best performing metal this week was gold, up 1.12 percent. The majority of gold traders and analysts were bullish in the weekly Bloomberg survey as concerns mount regarding the coronavirus spreading out of China. The yellow metal had a second monthly gain as investors flock to safe havens amid the global health emergency. China’s gold imports rose in December to the highest level since April, according to customs data. Total imports of non-monetary gold rose to 146,758 kilograms.
- Gold ETFs hit a seven-year high this week and it’s not just because fears of the coronavirus spreading. Bloomberg’s Ranjeetha Pakiam writes that gold has been in favor because the Fed had signaled interest rates are likely to remain low for some time. With real rates negative, it cuts the opportunity cost of holding gold. Bullion is historically lower after Chinese New Year when buying spikes before celebrations, but it might skip that seasonal lull this year.
- Saudi Arabia is set to pass a new mining law that will improve clarity and security for investors and include incentives, reports Bloomberg. The diamond industry has shown a glimmer of hope. De Beers reported that diamond sales jumped in January after a horrible 2019. Anglo American Plc said its unit sold $545 million of diamonds in its first sale of the year. AngloGold Ashanti Ltd reopened the century-old Obuasi gold mine in southern Ghana after operations were halted in 2016.
Weaknesses
- The worst performing metal this week was palladium, down 5.71 percent as hedge funds cut their net bullish view to a 16-month low. According to the World Gold Council (WGC), purchases of gold jewelry, bars and coins fell by 11 percent last year. However, most of that drop was offset by strong central bank and ETF buying. Total gold demand fell just 1 percent from 2018. The WGC also expects gold demand in India to slowly recover in 2020, with demand in the first half of the year likely not showing any significant growth. This follows the worst year for demand out of India in three years amid high bullion prices. Standard Chartered Bank’s Suki Cooper notes that gold jewelry sales out of China could take a hit from the coronavirus, just as it dropped following the SARS outbreak in 2003.
- According to data from the National Association of Realtors, pending home sales unexpectedly decreased by 4.9 percent in December from the prior month. Norilsk Nickel, the world’s biggest palladium miner, said a bubble has been created and that it’s bad for the industry. The company plans to ease market tightness by shifting sales to more investment-grade bars, instead of the powdered form used by industrial consumers, reports Bloomberg.
- Newcrest Mining said that production at its flagship Cadia operation in New South Wales, Australia could be impacted by the end of this year if the crippling drought continues in the region. The area has seen record low rainfall for the past two years.
Opportunities
- Heraeus, a palladium refiner, said that the palladium market should remain in a deficit of more than 500,000 ounces in 2020 due to stricter emission legislation boosting demand for use in autos. Bank of America sees rhodium peaking at a record $12,000 an ounce this year and averaging $10,500. Bloomberg’s Sungwoo Park writes that silver may resume its rally as a cheaper alternative to gold. Park notes that silver is still trading 64 percent below its all-time high, while gold is trading just 18 percent lower than its record, which means silver should benefit disproportionatly from any sustained flight to safety.
- Sibanye could finally pay a dividend for the first time in three years this August. The gold miner acquired Stillwater Mining Co. three years ago and critics said it overpaid for the palladium producer. However, the $2.2 billion investment could now pay off, reports Bloomberg. CEO Neal Froneman said in an interview that the company has almost entirely been de-risked. “I don’t want to be so bold as to say I told you so.”
- Nano One Materials announced that it has arranged a private placement for gross proceeds of up to $5 million that will be used for fast tracking testing and co-development activities including those with existing collaborators Volkswagen, Pulead and Saint-Gobain. The company said in a press release that the placement “positions us very well to execute on our business plan.” Nano One has developed patented technology for the low-cost production of high performance lithium ion battery cathode materials used in electric vehicles, energy storage and consumer electronics. Roxgold announced an increase of 7 percent increase in mineral resources at its Seguela Gold Project in Cote d’Ivoire.
Threats
- According to research released by the Harvard Joint Center for Housing Studies, the U.S. housing crisis is making its way to the heartland of the nation. Bloomberg reports that the study showed from 2011 to 2018, the proportion of households making $30,000 to $45,000 a year that were “cost-burdened” on rent rose the most in metros including Nashville, Greenville, McAllen and Austin. The data highlights the harsh reality of a decade-long expansion where there are fewer and fewer places to go for people who don’t make big salaries. The report also showed that about 48 percent of all renters were cost burdened in 2018.
- Two of the biggest gold miners are taking different approaches to making shareholders happy. Newmont is focusing on high dividends and improving operations at some of the mines it acquired in its deal for GoldCorp, while Barrick is looking at expanding its copper holdings, which has some shareholders concerned. Barrick has outperformed Newmont in the time since both of their megamergers; however, it will be interesting to see which takes the lead with these different investment strategies.
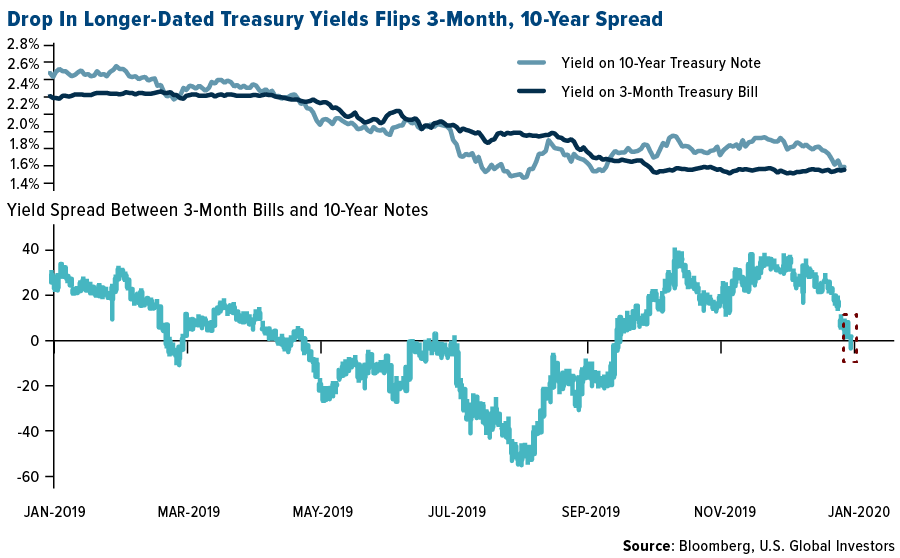
- Bloomberg’s Edward Bolingbroke reports that participants in the eurodollar market have been ponying up cash to buy options that hedge against the Federal Reserve cutting benchmark rates to zero, should a “doomsday” economic scenario occur in the next year. The gap between the yield on three-month and 10-year Treasuries inverted this week, which many see as a warning signing as it inverted before each of the past seven U.S. recessions.

Index Summary
- The major market indices finished down this week. The Dow Jones Industrial Average lost 2.53 percent. The S&P 500 Stock Index fell 2.12 percent, while the Nasdaq Composite fell 1.76 percent. The Russell 2000 small capitalization index lost 2.90 percent this week.
- The Hang Seng Composite lost 6.06 percent this week; while Taiwan was down 5.15 percent and the KOSPI fell 5.66 percent.
- The 10-year Treasury bond yield fell 17 basis points to 1.51 percent.
Domestic Equity Market
Strengths
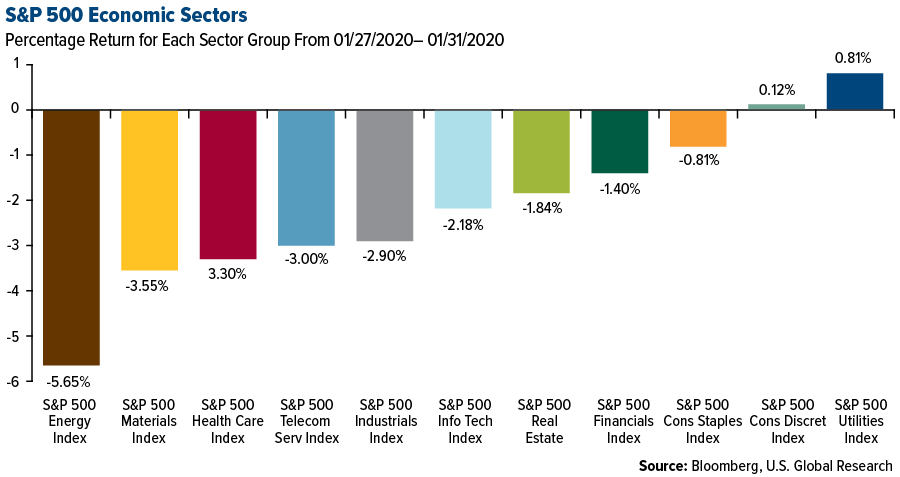
- Utilities was the best performing sector of the week, increasing by 0.80 percent versus an overall decrease of 2.13 percent for the S&P 500.
- L Brands was the best performing S&P 500 stock for the week, increasing 11.57 percent.
- Amazon.com Inc.’s valuation returned above $1 trillion on Friday after its results beat expectations, with analysts applauding the popularity of the e-commerce giant’s one-day shipping initiative and the performance of its cloud-computing business. Shares surged as much as 9.9 percent in their biggest one-day percentage gain since October 2017.
Weaknesses
- Energy was the worst performing sector for the week, decreasing by 5.66 percent versus an overall decrease of 2.13 percent for the S&P 500.
- Xilinx Inc was the worst performing S&P 500 stock for the week, falling 16.19 percent.
- Caterpillar Inc., a worldwide barometer for manufacturing, is warning of more pain to come for the global economy in 2020. The heavy-equipment maker is projecting its profits for the year will trail analysts’ estimates by a substantial margin. “We expect continued global economic uncertainty to pressure sales to users in 2020 and cause dealers to further reduce inventories,” Chief Executive Officer Jim Umpleby said in a statement.
Opportunities
- Deutsche Bank shares rose as a result of positive reception to the lender’s fourth-quarter earnings. RBC analysts said progress on capital is welcome and materially reduces the restructuring execution risk. While the stock still has no buy recommendations, analysts at Societe Generale upgraded it to hold from sell for the first time since 2014.
- Bayer AG’s shares gained after the U.S. Environmental Protection Agency (EPA) said glyphostate, the much-debated ingredient in the company’s Roundup pesticide, is safe to use.
- Reynolds Consumer Products, the maker of Reynolds Wrap aluminum foil and Hefty trash bags, rose in its trading debut after raising $1.23 billion in the biggest initial public offering by a household goods maker.
Threats
- Challenges are mounting for automakers as the industry is facing stricter carbon dioxide emission targets. For example, Daimler AG issued its third profit warning in less than nine months.
- Roku Inc. fell to its lowest in more than two months on Friday after the company began notifying customers that FOX channels will not be accessible on its platform ahead of the network’s Super Bowl broadcast this weekend. The news sent the stock on an abrupt slide, falling as much as 7.6%. Roku’s notice to customers comes as a distribution agreement with Fox is scheduled to expire, after hosting the network’s channels for years.
- The S&P 500 Industrials Index had been out front among sectors only to let up on Thursday, in part due to United Parcel Service Inc.’s accelerated spending plan. It will take more than a spate of solid reports for industrial stocks to gain lasting momentum against the S&P 500 Index. Over the past five years industrials have risen about 47 percent compared with 62 percent for the S&P 500.
The Economy and Bond Market
Strengths
- Consumer sentiment in the U.S. increased in January to an eight-month high, writes Bloomberg, indicating sustained optimism in the face of the coronavirus and the impeachment trial. The University of Michigan’s sentiment index for January rose to 99.8, up from 99.3 in December and compared with a preliminary reading of 99.1. The gain reflected a six-month high in expectations.
- The Federal Reserve held rates steady in its first policy-setting meeting of 2020, reports Yahoo! Finance, changing little in its economic outlook as the U.S. economy continues to extend its longest expansion on record. The Federal Open Market Committee (FOMC) announced Wednesday that it decided to keep rates in the current target range of 1.50 percent to 1.75 percent, continuing to describe the economy as “rising at a moderate rate.”
- The number of Americans who applied for unemployment benefits in late January fell slightly and gave no hint of rising layoffs, reports MarketWatch, indicating the labor market remains very robust. Initial jobless claims declined by 7,000 to 216,000 in the seven days ended Jan. 25, the government said Thursday.
Weaknesses
- There is little sign that underlying capex growth was improving at the end of the year, as the core measures of durable goods orders and shipments shrank unexpectedly in December. Perhaps the trade deal and the New Year will bring better tidings, but the headlines thus far in 2020 aren’t exactly supportive of businesses embarking on a spending spree.
- Gross domestic product in the U.S. grew at a 2.1 percent annual rate between October and December, the same as the previous three months, according to preliminary data released by the Commerce Department. As for 2019 as a whole, the report shows that the economy turned in a weaker annual showing than it did in 2017 and 2018, writes the NY Times.
- Pending home sales in December fell 4.9 percent from the prior month, the largest decline in almost a decade, according to a report Wednesday from the National Association of Realtors.
Opportunities
- The incubation period for the coronavirus is understood to be up to 14 days. Wuhan, the epicenter of the outbreak, has been locked down since January 23. If the quarantine is effective, the infection’s peak should be around the end of next week. In the SARS pandemic in 2003, markets bottomed when the infection cases peaked.
- The ISM manufacturing PMI for January will be released on Monday. While the forecast is for an improvement, it would still leave the reading stuck below 50, signaling continued contraction in the sector.
- Next Friday, all eyes will turn to the employment numbers for January. Nonfarm payrolls are expected to clock in at 156,000, mildly higher than the 145,000 in December, and a number consistent with further tightening in the jobs market. The unemployment rate is forecast to hold steady at 3.5 percent, while average hourly earnings are anticipated to accelerate slightly to 3.0 percent on a yearly basis, from 2.9 percent previously.
Threats
- A key slice of the U.S. yield curve inverted on Thursday for the first time since October, writes Bloomberg, reviving memories of growth fears that plagued investors last year. The spread between the yield on three-month and 10-year Treasuries slipped below zero, a day after the Fed kept rates unchanged. The yield curve has historically reflected the market’s sense of the economy and inflation, and this may be a signal that investors are concerned about policy makers’ ability to counter any headwinds as the deadly coronavirus threatens to disrupt global growth.
- The non-manufacturing PMI index will come out on Wednesday, with forecasts pointing to an uptick in the survey.
- The U.S. labor market has displayed some signs of stress lately, with real wage growth cooling substantially and job openings as measured by the JOLTS survey declining. This may be an early indication that overall employment growth may be set to slow down.
Energy and Natural Resources Market
Strengths
- The best performing major commodity for the week was lumber, which gained 2.32 percent. Weyerhaeuser reported it expects to see modest growth in 2020. According to the American Wind Energy Association, the top two states for wind power installed their most turbines ever in 2019. Texas added 4 gigawatts and Iowa added 1.7 gigawatts – both expanding their lead in wind power. Bloomberg reports that total U.S. installations were 9.1 gigawatts last year, which is the most since the expiration of federal tax credits triggered a building boom in 2012.
- BloombergNEF analysis revealed this week that wind and solar now make up around 20 percent of all generation in Australia. The nation’s largest network, the National Electricity Market (NEM), has commissioned 6.5 gigawatts of solar and 1 gigawatt of wind plants over the last two years. This represents progress for Australia, which has one of the most carbon intensive grids in the world.
- South Africa has been riddled with power outages due to aging coal-fired power stations and it has negatively impacted miners. Mining companies – including Sibanye, Anglo American Platinum and Gold Fields – are now planning to build 609 megawatts of electricity generating capacity, if they get official approval for the projects, reports Bloomberg. According to the Minerals Council, the projects are mainly photovoltaic solar and would generate power for the miners’ own use, leaving them less exposed to power outages from state-owned Eskom.
Weaknesses
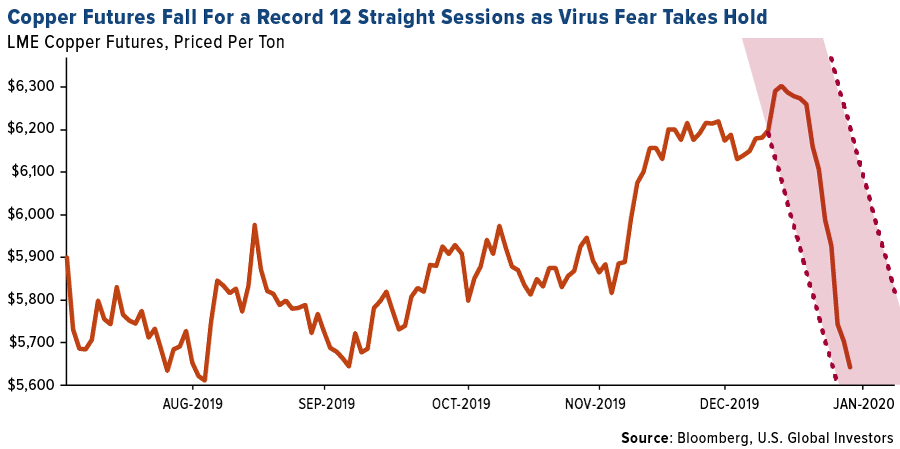
- The worst performing major commodity for the week was palm oil, which fell 8.98 percent in parallel with other energy markets. News of the coronavirus spreading further outside China sparked fear in the markets globally. China is the world’s largest consumer of many commodities, and with parts of the country shut down completely, it could hamper demand in the short-term. Bloomberg reports that China accounts for half of global base metals demand. Copper fell for 12 straight days and had its worst month since 2015 – falling 9.4 percent for the month. Several regions of the country announced businesses will not start operations until at least February 10, and these regions account for about 90 percent of total copper smelting and 60 percent of steel production.
- Oil had its biggest monthly loss since May as prices have fell 14 percent. China is the world’s largest importer of oil and there are fears that demand will be hurt from entire cities being locked down. The World Health Organization declared the outbreak as a global health emergency on Thursday.
- Lastly, iron was another major commodity to take a big hit this week and month. Iron is at risk of falling back into the $70 range due to coronavirus hurting Chinese demand, but also due to expectations that supplies of the metal will expand this year.
Opportunities
- Edge LNG has produced a portable LNG plant that can take gas directly from wells and turn it into a liquid, making it easier to ship and store. Bloomberg reports that the portable plant, which attaches to the bank of semi-trailer, can help tackle the problem of wasted natural gas that producers often have to vent into the air since there isn’t enough pipeline capacity in certain places. In North America alone, stranded gas is worth around $600 million.
- The EU is set to release a new law that would make its goal of climate neutrality binding. Frans Timmermans, executive vice president of the EU Commission, said that the climate law will require all corners of the economy to take action and give the institutions coordinating the shift legal authority to act when promises are broken, reports Bloomberg. This is a far-reaching strategy to eliminate greenhouse gas emissions and should help Europe hit its goal of becoming the first climate-neutral continent. Hydrogen is likely to get a big boost as a fuel for industry and recycling. In the U.K. a 30 billion pound ($39.3 billion) pension fund has notified managers if they fail to curb their exposure to climate change and position for a low-carbon economy, they will be fired.
- Bloomberg reports that French carmaker PSA Group and oil company Total SA have outlined a project to build batteries for electric cars in France and Germany. This is a bid to challenge Asian firms, which dominate the car segment of the energy storage space. It is also a sign that the car industry is ramping up work on electric vehicles. The PSA and Total plan will require $5.5 billion in investment by 2030.
Threats
- Eskom, the utility that generates 95 percent of South Africa’s power, warned the nation to prepare for more frequent power cuts since it will not delay planned maintenance, reports Bloomberg. The nation has faced an energy deficit since 2005 as Eskom has failed to keep up with aging plants and has amassed more than $30 billion in debt. The Council for Scientific and Industrial Research estimates that the power cuts may have cut as much as 118 billion rand from GDP in 2019.
- According to an analysis by S&P Global Ratings, around 60 percent of companies in the S&P 500 Index hold assets that are at high risk of at least once type of climate-related physical event. Bloomberg notes that real estate investment trusts, materials sector companies operating mines and processing plants and utilities are among the sectors facing heightened risks. Richard Mattison, CEO of Trucost, a division of S&P Global, said “heatwaves, wildfires, water stress and hurricanes linked to rising global temperatures represent the biggest physical risks for companies.”
- Analysts are forecasting that the top five oil companies – Exxon, Shell, Chevron, Total SA and BP – will all report lower fourth quarter profit due to record-low natural gas prices and weak refining and chemicals. Oil majors are known to be some of the biggest dividend payers and they must prove that these payouts can be sustained.

Emerging Europe
Strengths
- Romania was the best relative performing country this week, losing 1.9 percent. Markets around the world sold-off on worries over coronavirus spreading rapidly, surpassing the total number of SARS cases from the 2002-2003 epidemic. SC Fondul Proprietatea Sa and Purcari Wineries were the best performing stocks trading on the Bucharest exchange, gaining more than 2 percent over the past five day.
- The Romanian leu was the best performing currency this week, gaining 70 basis points. Romanian stocks and its currency appeared to be the safe-haven asset of Europe during this week’s sharp sell-off.
- Consumer staples was the best performing sector among eastern European markets this week.
Weaknesses
- The Czech Republic was the worst performing country this week, losing 6.2 percent. British cybersecurity company Avast PLC, shares of which are duly listed on the Prague and London exchanges, lost 22 percent over the past five days. Avast allegedly collected its users’ online activity data and sent that to Jumpshot, which then offered to sell the information to its own clients. Avast PLC is the fourth largest position in the Prague index.
- The Russian ruble was the worst performing currency in the region this week, losing 2.9 percent. Russia reported its first coronavirus case and halted most flights to China. The number of cases will likely grow quickly as Russia is well connected with China and developed a stronger relationship with the country over the past few years. The price of Brent crude oil declined by 4.2 percent on worries over weaker global demand.
- Energy was the worst performing sector among eastern European markets this week.
Opportunities
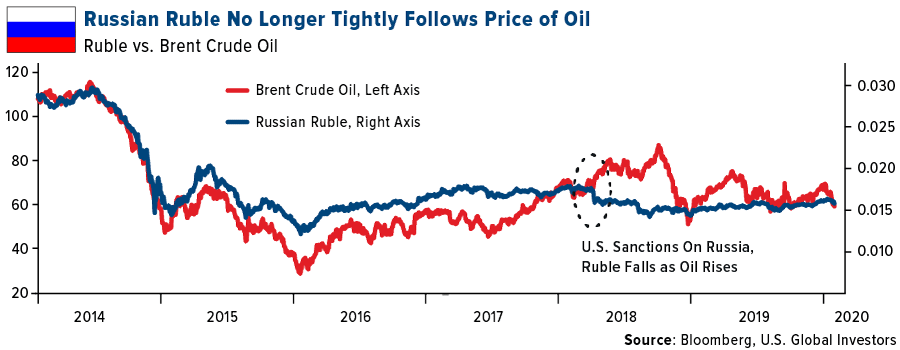
- The Russian ruble no longer moves tightly with the price of Brent crude oil. The chart below shows the decupling that took place in April 2018 when the U.S. imposed stricter sanctions on Russia. With oil correcting due to growing concerns over the coronavirus spread, the ruble may not follow. The currency will be supported by the country’s positive real rates and paying the highest equity dividends among global emerging markets.
- Renaissance Capital, in its 2020 Strategy, recommends to overweight Russia, Turkey and Greece. Economic growth will continue to bounce in Russia, dividend payout will increase and less political tension between Russia and Ukraine will create positive sentiment. In Turkey, government reforms will support economic growth, rates will continue to decline and the country will benefit from the cheap currency. Greece is expected to outperform due to growth acceleration, more capital flow, and a pick-up in industrial production. Contrary, Renaissance Capital recommends to underweight Poland, Hungary and equal-weight the Czech Republic.
- French President Emmanuel Macron will pay his first visit to Poland at the beginning of February. The French government has criticized Law & Justice, the ruling party in Poland, for its judicial reforms and for blocking the 2050 carbon-neutrality program. Tensions between Poland and Brussels have increased recently, and these meetings may present a good opportunity for dialogue. With the U.K. leaving the eurozone, Poland is becoming an even more important EU member. It is the EU’s sixth-largest country in terms of population and seventh largest in terms of GDP.
Threats
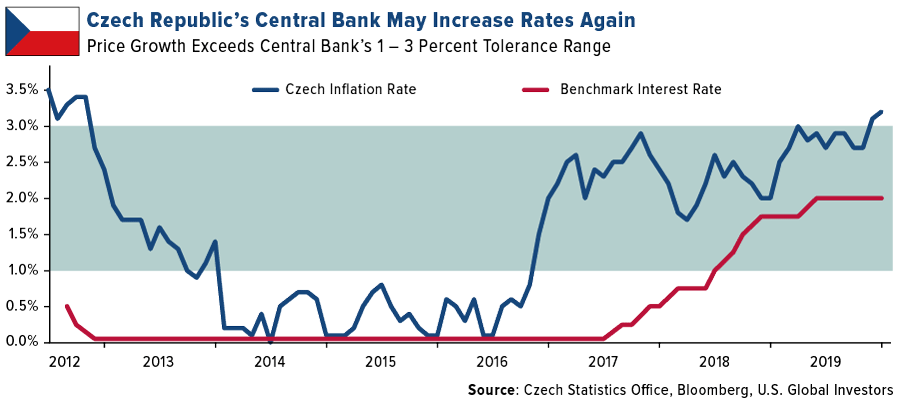
- Inflation in the Czech Republic spiked above the central bank’s upper bend target signaling more tightening, despite eight hikes in borrowing costs since 2017. While the U.S. Federal Reserve and the European Central Bank (ECB) are renewing monetary stimulus, this Easter European country is leaning the other way to cool its fastest inflation in seven years, fueled by record low unemployment, rising wages and consumer spending.
- Bank of England left its main rate unchanged but warned about slower growth after Brexit. The central bank forecast growth of just 0.8 percent in 2020, down from 1.3 percent in 2019 but rising to around 1.5 percent in 2021. The U.K. is set to leave the EU at 11pm London time on Friday and enter an 11-month negotiation period.
- Europe’s economy barely grew at the end of 2019 as contractions in France and Italy dragged it to its weakest quarter in almost seven years. Euro-area GDP rose 0.1 percent in the fourth quarter, down from 0.3 percent in the prior period. Core inflation slipped in January to the slowest pace in three months, getting further away from the ECB’s goal.
China Region
Strengths
- This being an obviously tough week for Asian and Southeast Asian stocks, the “strongest” market—the one that held up best since last week—turned out to be Singapore, falling 2.56.
- South Korea’s industrial production for the most recent (December) period came in stronger both month-over-month and year-over-year, clocking in at 3.5 percent growth and 4.2 percent growth, respectively, ahead of expectations for only 0.7 percent and 1.0 percent growth, respectively.
- China’s Non-manufacturing Purchasing Manager’s Index (PMI) for the January period—which, granted, measures the period prior to the coronavirus concerns—actually beat expectations, continuing to climb up from the prior reading of 53.5 to 54.1.
Weaknesses
- Hong Kong’s Hang Seng Composite dropped by a sadly regionally-downside-leading 6.06 percent for the week, making it a rough couple of weeks for Hong Kong in particular. China’s week-long closure this week following New Year closures last week means China staved off the expected drop until next week.
- Vietnamese exports came in much weaker than expected, dropping 14.3 percent year-over-year from the January period while imports declined 11.3 percent for the same time. Both numbers were expected to be closer to 10 percent gains, instead. Inflation rose, with the consumer price index (CPI) up to 6.43 percent year-over-year.
- China’s latest official Manufacturing PMI— though measuring the period prior to the exponential increase in coronavirus cases and the New Year holidays—dropped to 50.0. This was consensus, though down from the prior reading of 50.2.
Opportunites
- Amid this week’s lengthened Lunar New Year holidays, it is again worth noting that amid the rapid declines may well lie opportunity, so stay sharp and nimble in the Year of the Rat!
- Remember the U.S.-China Phase One trade deal? Presumably that’s still a thing, but it’s not being discussed much this week, for obvious reasons. Something else not being discussed much this week—also obviously—are the Hong Kong protests. For better or worse, a period of fears of viral infections may ironically contribute to a possible sooner return to business as usual in Hong Kong or more stability in the streets. No one, of course, can say for sure, but it is a conceivable thought. Mistrust for the Lam government reportedly still runs high—and unlikely to change overnight—but there will literally be a lack of physical momentum to any protest movements in the midst of a virus scare, which may afford more time or room for stabilization and progress in one way or another in the interim. Again, time will tell.
- And well…there’s always that price-to-earnings (P/E) ratio lately: the blue-chip Hang Seng Index in Hong Kong is now down sharply from its levels a couple of weeks ago, with the HSI currently sitting (ahead of China’s reported reopening next week) at a 10.28 times earnings.
Threats
- This week, the World Health Organization (WHO), in an emergency meeting and a shift from last week, declared the Wuhan coronavirus outbreak an “international health emergency.” The official confirmed cases now outnumber those of the SARS outbreak in 2002-2003, and are now just shy of 10,000 globally, with the vast majority of those in mainland China. The Centers for Disease Control and Prevention (CDC) made a statement from the White House on Friday, late in trading, that the overall risk to the U.S. public is low.
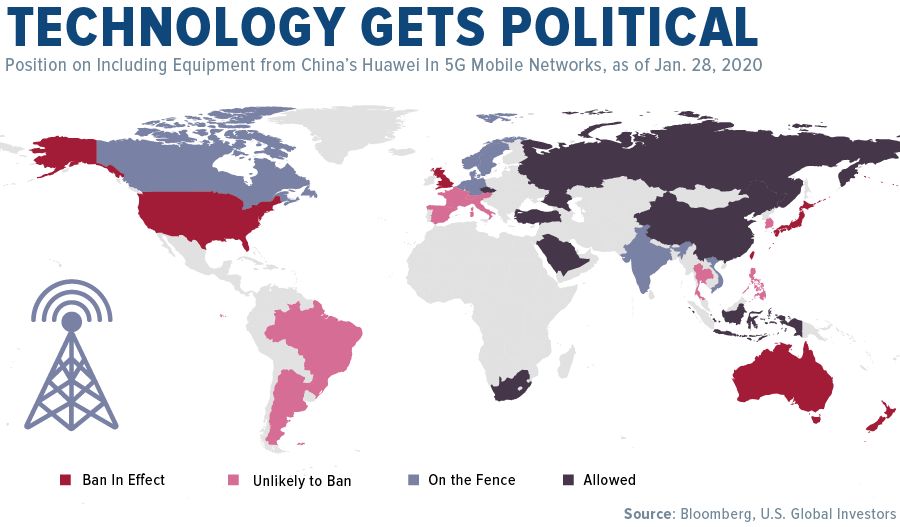
- The 5G infrastructure battle and tensions may yet continue for some time, but there were some interesting developments this week as the U.K. announced that it would indeed let Huawei Technologies Co. play a limited role in building out the U.K.’s next-gen wireless broadband networks. Reportedly “high-risk” vendors (like Huawei), however, will be “excluded from sensitive geographic locations, such as nuclear sites and military bases.” The European Union (EU) also appears to be sparing Huawei from a total ban.
- Tourism to Thailand is already being estimated to take something like a potential $3.1 billion hit through April as the virus scare keeps Chinese visitors away. On the bright side, the Thai government officials are saying they may need to prepare a new round of economic measures.
Blockchain and Digital Currencies
Strengths
- Of the cryptocurrencies tracked by CoinMarketCap, the best performing for the week ended January 31 was eosDAC, up 584.33 percent.
- According to a Charles Schwab report originally released at year-end, new data shows that millennials prefer to hold bitcoin equity than invest in some of the world’s best-known companies, reports CoinTelegraph. Of assets held as equity with Schwab, 1.84 percent are in the Grayscale Bitcoin Trust (record participation in 2019). That is more than equity millennials held in Berkshire Hathaway, Netflix, Disney Corp, Microsoft and Alibaba.
- Could an altcoin revival be in the works? Mid-week, Cardano broke above its six-month range and now follows the movements of large-cap altcoins like Bitcoin Cash, Dash and Ethereum Classic, writes CoinTelegraph. In addition, an apparent breakthrough of the $65 billion resistance level of altcoin market capitalization resulted in an upward trend toward $80 billion. The $80 billion level is significant because it has been tested several times in recent months, the article continues, meaning a renewed test of this level usually follows a breakthrough.
Weaknesses
- Of the cryptocurrencies tracked by CoinMarketCap, the worst performing for the week ended January 31 was Silverway, down 70.47 percent.
- Rostec, a Russian government-backed corporation, intends to cut spending on blockchain development in the country by at least 50 percent, writes CoinTelegraph. According to a spokesperson, there currently is a change in the perception of the technology, “a self-cleaning of the market from copy projects that do not have a development strategy and certain market niche.”
- According to a new report from Electronic Frontier Foundation (EFF), a San Francisco civil liberties nonprofit, third-party trackers are pulling personal data from users of Ring – the home security company owned by Amazon. Senior staff technologist Bill Budington who wrote the report, found that the Ring app was sharing data such as IP addresses, full names, email address, information about whether Bluetooth is enabled and even sensor data from the device being used to access the app.
Opportunities
- Saudi Aramco, Saudi Arabia’s state oil company, has bought into blockchain-based oil trading company Vakt, according to a report from Reuters on Tuesday. A press release from Vakt shows that Saudi Aramco’s Energy Ventures branch has bought $5 million in new shares. The investment will be used to develop the platform, writes CoinTelegraph, with a focus on expansion into the Asian market.
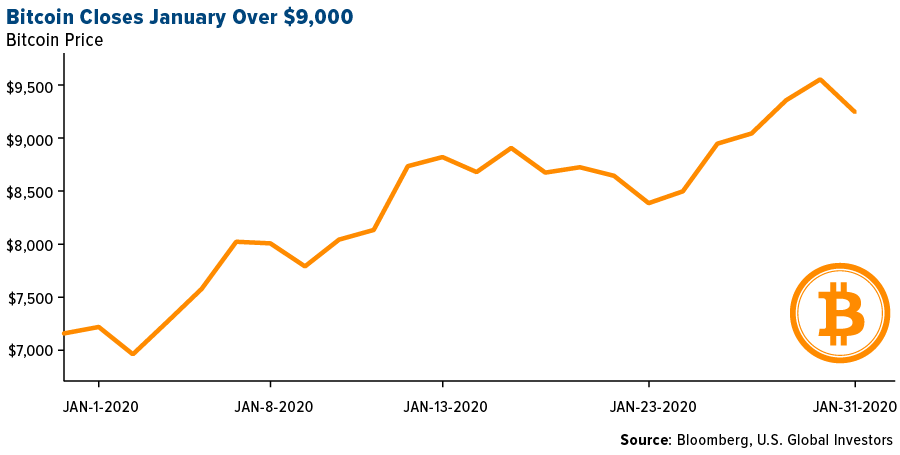
- Bitcoin is up 30 percent on a month-to-date basis, reports CoinDesk, its best January performance since 2013. In addition, the cryptocurrency is on track to register a double-digit monthly gain for the first time since June 2019, when prices had rallied by 26 percent.
- It appears as though crypto lenders may be flourishing more than traditional banks, reports CoinDesk. According to the article, a lukewarm U.S. economy is causing big banks like JPMorgan Chase to struggle producing fast loan growth, even with interest rates close to historic lows. However, for lenders like Genesis, a New York-based trading firm that lends cash alongside cryptocurrencies, loans increased by 21 percent during the fourth quarter to $545 million.
Threats
- Bitfinex has been ordered to freeze bitcoin worth $860,000 after the exchange and “blockchain sleuthing firm” Chainalysis traced the funds to a ransomware payment, writes CoinDesk. According to a filing published last week by the England and Wales High Court, the victim of the ransomware attack has paid $950,000 to the perpetrator through an insurance company.
- A lawsuit accuses the front man of the TRON cryptocurrency and his business associate of harassing and firing two employees, writes CoinDesk, allegedly as payback for the employees’ objections to management practices and applications of the technology they were developing.
- A senior adviser to the operator of the Silk Road dark web marketplace has pled guilty to one count of conspiracy to distribute narcotics in a Manhattan federal court, reports CoinTelegraph. A press release from Thursday from the U.S. Department of Justice states that Thomas Clark, a key figure in the development of the Silk Road, even attempted a murder-for-hire of a Silk Road employee – who was suspected of stealing $350,000 of bitcoin from the organization.

Leaders and Laggards
| Index | Close | Weekly Change($) |
Weekly Change(%) |
|---|---|---|---|
| 10-Yr Treasury Bond | 1.51 | -0.18 | -10.62% |
| Oil Futures | 51.62 | -2.57 | -4.74% |
| Hang Seng Composite Index | 3,587.47 | -231.30 | -6.06% |
| S&P Basic Materials | 361.99 | -13.29 | -3.54% |
| Korean KOSPI Index | 2,119.01 | -127.12 | -5.66% |
| S&P Energy | 405.45 | -24.26 | -5.65% |
| Nasdaq | 9,150.94 | -163.98 | -1.76% |
| DJIA | 28,256.03 | -733.70 | -2.53% |
| Russell 2000 | 1,614.06 | -48.17 | -2.90% |
| S&P 500 | 3,225.52 | -69.95 | -2.12% |
| Gold Futures | 1,592.40 | +14.20 | +0.90% |
| XAU | 103.94 | -0.88 | -0.84% |
| S&P/TSX VENTURE COMP IDX | 575.18 | -6.58 | -1.13% |
| S&P/TSX Global Gold Index | 266.69 | +2.13 | +0.81% |
| Natural Gas Futures | 1.84 | -0.05 | -2.69% |
| Index | Close | Monthly Change($) |
Monthly Change(%) |
|---|---|---|---|
| Korean KOSPI Index | 2,119.01 | -78.66 | -3.58% |
| 10-Yr Treasury Bond | 1.51 | -0.41 | -21.52% |
| Gold Futures | 1,592.40 | +63.10 | +4.13% |
| S&P Basic Materials | 361.99 | -23.86 | -6.18% |
| S&P 500 | 3,225.52 | -5.26 | -0.16% |
| DJIA | 28,256.03 | -282.41 | -0.99% |
| Nasdaq | 9,150.94 | +178.33 | +1.99% |
| Oil Futures | 51.62 | -9.44 | -15.46% |
| Hang Seng Composite Index | 3,587.47 | -240.08 | -6.27% |
| S&P/TSX Global Gold Index | 266.69 | +5.39 | +2.06% |
| XAU | 103.94 | -2.98 | -2.79% |
| Russell 2000 | 1,614.06 | -54.41 | -3.26% |
| S&P Energy | 405.45 | -51.01 | -11.18% |
| S&P/TSX VENTURE COMP IDX | 575.18 | -2.36 | -0.41% |
| Natural Gas Futures | 1.84 | -0.35 | -15.85% |
| Index | Close | Quarterly Change($) |
Quarterly Change(%) |
|---|---|---|---|
| XAU | 103.94 | +8.32 | +8.70% |
| S&P/TSX Global Gold Index | 266.69 | +16.87 | +6.75% |
| Gold Futures | 1,592.40 | +65.50 | +4.29% |
| DJIA | 28,256.03 | +1,209.80 | +4.47% |
| S&P 500 | 3,225.52 | +187.96 | +6.19% |
| Nasdaq | 9,150.94 | +858.58 | +10.35% |
| Korean KOSPI Index | 2,119.01 | +35.53 | +1.71% |
| Natural Gas Futures | 1.84 | -0.79 | -30.04% |
| S&P Basic Materials | 361.99 | -2.74 | -0.75% |
| Russell 2000 | 1,614.06 | +51.61 | +3.30% |
| Oil Futures | 51.62 | -2.56 | -4.72% |
| Hang Seng Composite Index | 3,587.47 | -44.67 | -1.23% |
| S&P/TSX VENTURE COMP IDX | 575.18 | +36.81 | +6.84% |
| S&P Energy | 405.45 | -21.21 | -4.97% |
| 10-Yr Treasury Bond | 1.51 | -0.19 | -10.99% |
U.S. Global Investors, Inc. is an investment adviser registered with the Securities and Exchange Commission ("SEC"). This does not mean that we are sponsored, recommended, or approved by the SEC, or that our abilities or qualifications in any respect have been passed upon by the SEC or any officer of the SEC.
This commentary should not be considered a solicitation or offering of any investment product.
Certain materials in this commentary may contain dated information. The information provided was current at the time of publication.
Some links above may be directed to third-party websites. U.S. Global Investors does not endorse all information supplied by these websites and is not responsible for their content.
Holdings may change daily. Holdings are reported as of the most recent quarter-end. The following securities mentioned in the article were held by one or more accounts managed by U.S. Global Investors as of (12/31/2019):
Royal Dutch Shell Plc
Anglo American Plc
Gold Fields Ltd
Anglo American Plc
AngloGold Ashanti Ltd
MMC Norilsk Nickel PJSC
Newmont Corp
Nano One Materials Corp
Roxgold Inc
*The above-mentioned indices are not total returns. These returns reflect simple appreciation only and do not reflect dividend reinvestment. The Dow Jones Industrial Average is a price-weighted average of 30 blue chip stocks that are generally leaders in their industry. The S&P 500 Stock Index is a widely recognized capitalization-weighted index of 500 common stock prices in U.S. companies. The Nasdaq Composite Index is a capitalization-weighted index of all Nasdaq National Market and SmallCap stocks. The Russell 2000 Index® is a U.S. equity index measuring the performance of the 2,000 smallest companies in the Russell 3000®, a widely recognized small-cap index. The Hang Seng Composite Index is a market capitalization-weighted index that comprises the top 200 companies listed on Stock Exchange of Hong Kong, based on average market cap for the 12 months. The Taiwan Stock Exchange Index is a capitalization-weighted index of all listed common shares traded on the Taiwan Stock Exchange. The Korea Stock Price Index is a capitalization-weighted index of all common shares and preferred shares on the Korean Stock Exchanges. The Philadelphia Stock Exchange Gold and Silver Index (XAU) is a capitalization-weighted index that includes the leading companies involved in the mining of gold and silver. The U.S. Trade Weighted Dollar Index provides a general indication of the international value of the U.S. dollar. The S&P/TSX Canadian Gold Capped Sector Index is a modified capitalization-weighted index, whose equity weights are capped 25 percent and index constituents are derived from a subset stock pool of S&P/TSX Composite Index stocks. The S&P 500 Energy Index is a capitalization-weighted index that tracks the companies in the energy sector as a subset of the S&P 500. The S&P 500 Materials Index is a capitalization-weighted index that tracks the companies in the material sector as a subset of the S&P 500. The S&P 500 Financials Index is a capitalization-weighted index. The index was developed with a base level of 10 for the 1941-43 base period. The S&P 500 Industrials Index is a Materials Index is a capitalization-weighted index that tracks the companies in the industrial sector as a subset of the S&P 500. The S&P 500 Consumer Discretionary Index is a capitalization-weighted index that tracks the companies in the consumer discretionary sector as a subset of the S&P 500. The S&P 500 Information Technology Index is a capitalization-weighted index that tracks the companies in the information technology sector as a subset of the S&P 500. The S&P 500 Consumer Staples Index is a Materials Index is a capitalization-weighted index that tracks the companies in the consumer staples sector as a subset of the S&P 500. The S&P 500 Utilities Index is a capitalization-weighted index that tracks the companies in the utilities sector as a subset of the S&P 500. The S&P 500 Healthcare Index is a capitalization-weighted index that tracks the companies in the healthcare sector as a subset of the S&P 500. The S&P 500 Telecom Index is a Materials Index is a capitalization-weighted index that tracks the companies in the telecom sector as a subset of the S&P 500. The NYSE Arca Gold Miners Index is a modified market capitalization weighted index comprised of publicly traded companies involved primarily in the mining for gold and silver. The Consumer Price Index (CPI) is one of the most widely recognized price measures for tracking the price of a market basket of goods and services purchased by individuals. The weights of components are based on consumer spending patterns. The Purchasing Manager’s Index is an indicator of the economic health of the manufacturing sector. The PMI index is based on five major indicators: new orders, inventory levels, production, supplier deliveries and the employment environment. The S&P/TSX Venture Composite Index is a broad market indicator for the Canadian venture capital market. The index is market capitalization weighted and, at its inception, included 531 companies. A quarterly revision process is used to remove companies that comprise less than 0.05% of the weight of the index, and add companies whose weight, when included, will be greater than 0.05% of the index. Gross domestic product (GDP) is the monetary value of all the finished goods and services produced within a country’s borders in a specific time period, though GDP is usually calculated on an annual basis. It includes all of private and public consumption, government outlays, investments and exports less imports that occur within a defined territory.
There is no guarantee that the issuers of any securities will declare dividends in the future or that, if declared, will remain at current levels or increase over time. The University of Michigan Confidence Index is a survey of consumer confidence conducted by the University of Michigan. The report, released on the tenth of each month, gives a snapshot of whether or not consumers are willing to spend money. The job openings and labor turnover survey (JOLTS) is a survey done by the United States Bureau of Labor Statistics to help measure job vacancies. It collects data from employers including retailers, manufacturers and different offices each month. The cyclically adjusted price-to-earnings ratio, commonly known as CAPE, Shiller P/E, or P/E 10 ratio, is a valuation measure usually applied to the US S&P 500 equity market. It is defined as price divided by the average of ten years of earnings, adjusted for inflation.
