


The Power of Scarcity
Date Posted: August 30, 2019
Read time: 53 min
There are a number of lessons investors can learn from the sensation that is the Popeyes chicken sandwich. One of those lessons is that people often put a premium on scarcity.
Press Release: U.S. Global Investors Announces Fiscal Year 2019 Results Webcast
By Frank Holmes
CEO and Chief Investment Officer
U.S. Global Investors
The fast food world gave us an interesting case study in supply and demand this week. By now you’ve no doubt heard about The Chicken Sandwich, the surprise superstar menu item from Popeyes Louisiana Kitchen that’s launched 1,000 blog posts, op-eds and thought pieces.
According to reports, the Cajun restaurant sold out of its entire seven-week inventory in just over two weeks. All of this despite no marketing campaign to speak of.
As what often happens when demand outpaces supply this dramatically, the value of the Popeyes sandwich has exploded on the secondary market. One Maryland man managed to sell his for $100, an incredible 2,400 percent markup over the retail price of $3.99. In a viral Instagram video, rapper Quavo flashes a bag full of the chicken sandwiches and (jokingly) offers to let them go for “a thousand a chicken.”
There are a few lessons investors can learn here—one of them being that people put a premium on scarcity.
Gold and Munis Look Attractive With Limited Supply
Gold is an obvious example. The precious metal is both rare and finite, making it an ideal global currency. Although output continues to grow, the number of large, high-grade gold discoveries has been declining for decades now. Some experts, myself included, believe peak gold is already here.
Copper could soon be in the same boat. The red metal isn’t nearly as rare as gold is, but because of surging global demand, mostly for use in electric vehicles and renewable energy, it’s expected to go into deficit in 2021.
“A single wind turbine can have up to a ton of copper wiring in the massive generators at the top of the tower,” the Oxford Club’s David Fessler told me in an interview earlier in the month.
Municipal bonds couldn’t be more different from chicken sandwiches—except when it comes to limited supply. Thanks in part to the 2017 tax overhaul, issuance of new state and local debt has been down for the past couple of years and is lagging the amount of bonds that are maturing. This has helped push up demand.
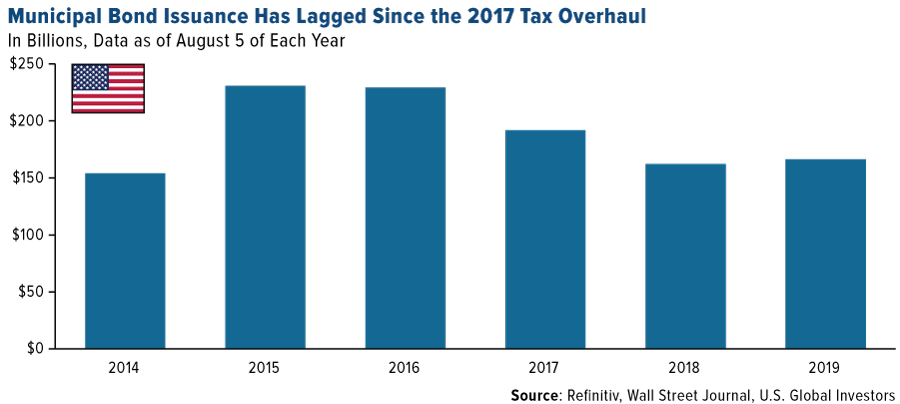
Mutual funds that invest in tax-exempt muni bonds have recently seen record inflows. In the first seven months of 2019, muni funds attracted more than $52 billion, the most ever for the January-July period since Lipper began reporting this data since in 1992.
I believe it’s prudent to be adding munis right now. Recession indicators are blinking, and in the past, muni bonds have performed well during economic pullbacks. In fact, municipal debt has delivered positive annual returns in all but four years going back to 1981.
Be Mindful of Share Dilution
Too much of something, on the other hand, can destroy its value. Look at what excessive money-printing has done to Venezuela’s struggling economy. The South American country’s inflation rate has risen to an unbelievable 10 million percent since 2018, according to the International Monetary Fund (IMF).
Share dilution can be similarly destructive. When a company issues new equity, each existing share is worth less. Ownership becomes watered down, and stock prices can fall.
Beyond Meat learned this lesson as recently as this summer. The California-based faux-meat company had a knockout debut in May, rising 163 percent on its first day—the best performing single-day IPO in about two decades. Shares were up 800 percent in late July when Beyond Meat announced a secondary equity offering of 3.25 million shares. Investors responded by knocking the stock down some 17 percent.
At U.S. Global Investors, we’re particularly mindful of outstanding share growth over time. This is especially the case when evaluating gold mining stocks, some of which have a history of diluting shareholder capital. Way back in 2013, I showed you how this could be one reason why gold stocks were underperforming bullion.
We like gold royalty and streaming companies partly because shares are not diluted. Take a look at the chart below. Since 2012, the top three royalty companies—Franco-Nevada, Wheaton Precious Metals and Royal Gold—have increased the number of outstanding shares between 11 percent and 27 percent. Now compare that to the constituents in the VanEck Vectors Junior Gold Miners ETF (GDXJ). At 57 percent share growth, ownership has been more than halved over the past seven years.

What’s more, when the royalty companies sign a new streaming contract, it actually improves its price-to-book value (P/B).
Gold Has Been a Good Hedge in Times of Economic Instability
As I recently showed you, gold has been a good hedge in times of economic instability. In 13 out of 15 of the worst months for the S&P 500 Index going back to 1987, gold outperformed the market, sometimes by as much as 110 basis points.
To be sure, the risks are mounting. On Sunday, the U.S. is scheduled to impose new 15 percent tariffs on $300 billion worth of Chinese goods. Approximately 92 percent of all apparel imported from China will be subject to taxation, paid for by American companies and consumers, so we should expect to see increased inflation.
In a note to investors this week, Goldman Sachs raised its estimate of the new tariffs’ impact on GDP growth. “The most recent proposed tariff escalation would boost U.S. consumer prices slightly further than previously estimated and would reduce U.S. growth slightly further as well,” bank analysts wrote, adding that they’ve raised their estimates of the impact to GDP growth to 0.7 percent by the end of this year.

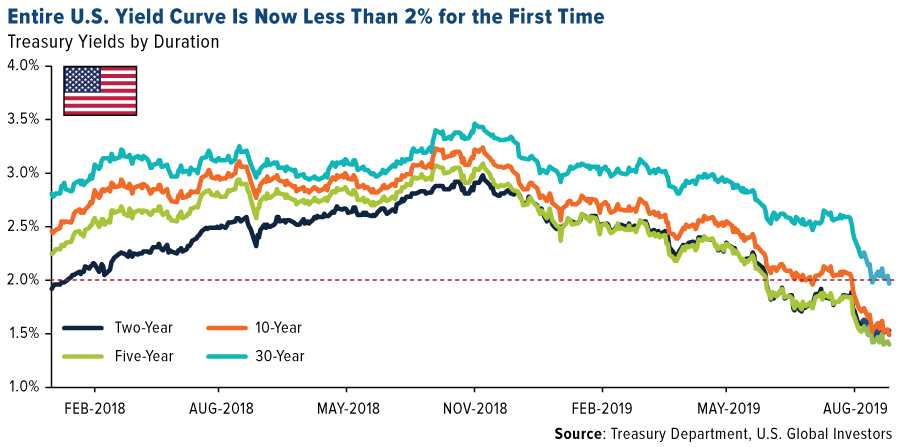
The U.S.-China trade war, about to enter its 18th month, has contributed to a rally in Treasury bonds as investors seek safety in government debt. This has pushed yields across the entire U.S. yield curve to record or near-record lows. On Tuesday, the yields on the two-year, five-year, 10-year and 30-year bond were all trading below 2 percent for the first time ever.
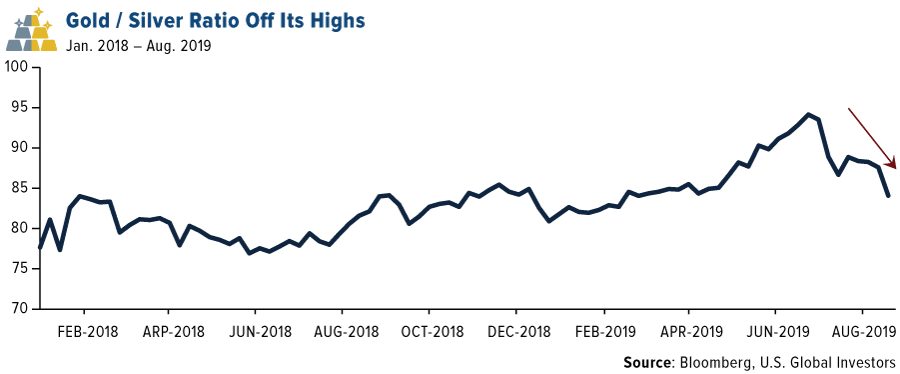
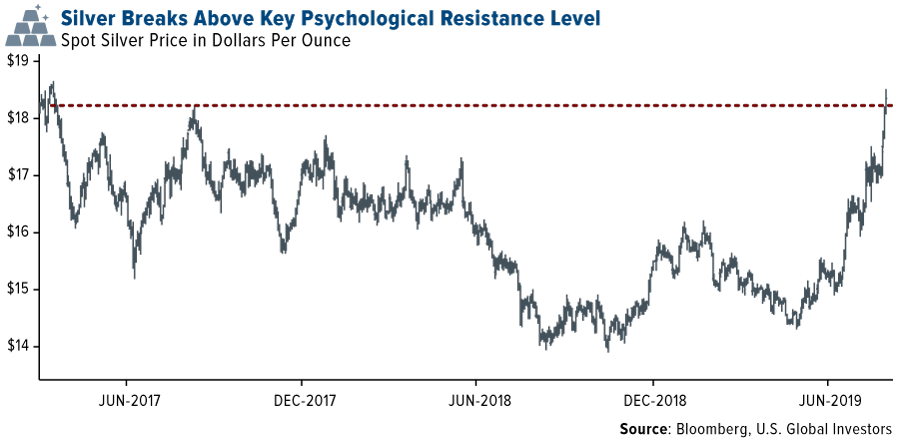
Precious metals have also rallied. Gold is now trading near a six-year high, while the price of silver broke above $18 an ounce for the first time since January 2018. The gold-to-silver ratio—which measures the number of ounces of silver it takes to buy one ounce of gold—has fallen from its recent high of 94 and now stands at around 83.
China’s Solution: Establish New Free Trade Zones (FTZs)
In the late 1970s, Chinese leader Deng Xiaoping helped spur his country to new heights through the creation of seven Special Economic Zones (SEZs), mostly in eastern port cities. With markets liberalized, money poured in from foreign investors, and China was well on its way to becoming a middle-income economy.
Shenzhen, the first of these SEZs, has undergone among the most dramatic (and fastest!) growth periods in human history. Forty years ago, it was a sleepy fishing town of around 30,000. Today, it’s home to not only 12.5 million people but also one of the world’s biggest stock exchanges by market cap.

My reason for bringing this up is that China, partly in response to the trade war, is set to create new free trade zones (FTZs) in six provinces across the country, according to the South China Morning Post.
The move “adds free trade zones in underdeveloped provinces, making them more attractive to high quality manufacturing in a bid to support their local economies and help weather the impact from the escalating trade war with the United States,” the Post writes.
I for one am excited for this news. You can read more about the announcement in the China Region section below!

Gold Market
This week spot gold closed at $1,520.30, down $6.60 per ounce, or 0.43 percent. Gold stocks, as measured by the NYSE Arca Gold Miners Index, ended the week higher by 1.60 percent. The S&P/TSX Venture Index came in up 1.27 percent. The U.S. Trade-Weighted Dollar rose 1.21 percent.
| Date | Event | Survey | Actual | Prior |
|---|---|---|---|---|
| Aug-26 | Hong Kong Exports YoY | -8.2% | -5.7% | -9.0% |
| Aug-26 | Durable Goods Orders | 1.2% | 2.1% | 1.8% |
| Aug-27 | Conf. Board Consumer Confidence | 129.0 | 135.1 | 135.8 |
| Aug-29 | Germany CPI YoY | 1.5% | 1.4% | 1.7% |
| Aug-29 | GDP Annualized QoQ | 2.0% | 2.0% | 2.1% |
| Aug-29 | Initial Jobless Claims | 214k | 215k | 211k |
| Aug-30 | Eurozone CPI Core YoY | 1.0% | 0.9% | 0.9% |
| Sept-1 | Caixin China PMI Mfg | 49.8 | — | 49.9 |
| Sept-3 | ISM Manufacturing | 51.2 | — | 51.2 |
| Sept-5 | ADP Employment Change | 145k | — | 156k |
| Sept-5 | Initial Jobless Claims | 212k | — | 211k |
| Sept-5 | Durable Goods Orders | — | — | 2.1% |
| Sept-6 | Change in Nonfarm Payrolls | 164k | — | 164k |
Strengths
- The best performing metal this week was platinum, up 8.86 percent. Platinum had its best week since 2011 as haven demand for gold expands to other precious metals. Gold rose to as much as $1,550 an ounce this week due to the escalated U.S.-China trade war. And silver is catching up. The gold/silver ratio was trading at its lowest level since April 17, which indicates that the silver price is starting to trade more like gold, but still has some room to go higher.
- Turkey’s official gold reserves rose 4.3 tons month-over-month in July to a total of 466.3 tons. Last week was strong for commodity ETF inflows. Precious metals ETFs led the way and saw holdings grow by $815 million to total $1.59 billion.
- The Reserve Bank of India grew its gold holdings by 9.2 percent in the year ended June, which was its biggest purchase in almost a decade, reports Bloomberg. India’s central bank purchased 51.93 tons of gold to raise its total holdings to 618.16 tons. ANZ estimates global central bank buying of gold will remain strong and above 650 tons annually in the coming years.
Weaknesses
- The worst performing metal this week was gold, down only 0.43 percent. Reuters reports that a crisis has been quietly brewing in the gold market. In the past three years, gold bars worth at least $50 million were stamped with Swiss refinery logos, but were not actually produced there. At least 1,000 bars have been found. Richard Hayes, CEO of the Perth Mint, has not found any fraudulent branded Perth Mint bars, but did say he has little doubt the bars are circulating globally. “It’s a wonderful way of laundering conflict gold. The gold is genuine, but it’s not ethically sourced… They look completely genuine, they assay correctly, and they weight correctly as well.”
- China’s purchases of gold from Hong Kong fell to 8.3 tons in July, down from 14.7 in June, according to calculations by Bloomberg based on data from the Hong Kong Census and Statistics Department. This was the lowest level in more than eight years. However, this is not surprising given the current and longstanding protests in Hong Kong against Chinese intervention.
- Although some progress was made between the U.S. and China on the trade war front, it remains a threat to global economic stability. Gold has risen over 20 percent so far this year and some think it might be overbought. The 14-week relative strength gauge for gold has risen to overbought levels, which in the past as signaled short-term peaks, according to Bloomberg.
Opportunities
- Negative real rates could pave the way for gold, and platinum’s rally this year. As the growing list of negatives in the markets adds up, it strengthens the case for holding precious metals. Ranjeetha Pakiam of Bloomberg writes “with bond prices on the rise as investors seek havens, that means the yields they now pay are lower than the pace of consumer price gains. That’s a tremendous boon for good, which doesn’t pay interest.” Silver has surged 13 percent this month and hit a two-year high on Wednesday, benefitting like gold is from the global economic outlook falling. The gold/silver ratio is also a bullish sign for the white metal. In July one ounce of gold was worth 93 ounces of silver and now that ratio is down to just under 84, but still above the 30-year average of 67 ounces.
- George Topping and Puneet Singh of IA Securities wrote an update of its precious metals price forecasts for the third quarter and rest of 2019. They expect that a new cycle has just begun and that the peak is above the last cycle peak due to the trade war potentially expanding to a currency war. They expect juniors to benefit after seniors and mid-tier producers due to lower liquidity and higher risk, but that there are many junior takeover targets.
- Many bullish price forecasts were released this week. UBS said it is staying long gold and predicts that the metal might hit $1,600 per ounce in the next three months. Citigroup also raised the possibility of gold extending its rally, reports Bloomberg. Looking at the ratio between bullion and the S&P 500 Index, Shyam Devani said in a note that “it is only a matter of time before a significant bullish break occurs that could trigger a rally to the tune of 25 percent in favor of gold.” ABN Amro Bank expects further gains in platinum. Senior Precious Metals Analyst Georgette Boele said platinum “is extremely cheap versus good, silver and palladium, and we can hardly imagine a sharp sell-off in platinum prices.” Platinum did have a stellar week, rising 4.7 percent on Wednesday and hitting a 15-month high.
Threats
- This month has been the busiest August for ETF traders in eight years, writes Bloomberg, as we are heading into week four following the first U.S. rate cut in more than a decade. According to data compiled by Bloomberg, nearly $2.2 trillion of ETF shares have changed hands this month. “Nowhere was this more evident than within the bond market, where ETF trading topped its record for the month,” the article reads. In a separate note from Bloomberg this week, Janet Miu of Cazenove Capital says the group favors gold over bonds as an uncertainty hedge.
- According to Bloomberg, the current respite in the “relentless drop in yields” that has taken hold of the $16 trillion Treasury market isn’t likely to last for very long. In fact, Tony Farren of Academy Securities sees a possibility of the five-year Treasury yield hitting 1 percent, the 10-year breaking its record low, and the 30-year falling to 1.70 percent to 1.75 percent, all by mid-October. Farren says the only thing that could alter the equation is a resolution to the U.S.-China trade tensions.
- One of the world’s largest wealth managers, UBS, has turned bearish on equities for the first time since the eurozone crisis, reports Bloomberg. According to the article, President Trump’s decision to increase tariffs last Friday on $250 billion of Chinese goods to 30 percent from 25 percent prompted the downgrade.

Index Summary
- The major market indices finished up this week. The Dow Jones Industrial Average gained 3.02 percent. The S&P 500 Stock Index rose 2.70 percent, while the Nasdaq Composite climbed 2.72 percent. The Russell 2000 small capitalization index gained 2.36 percent this week.
- The Hang Seng Composite lost 1.74 percent this week; while Taiwan was up 0.76 percent and the KOSPI rose 1 percent.
- The 10-year Treasury bond yield fell 4 basis points to 1.497 percent.
Domestic Equity Market
Strengths
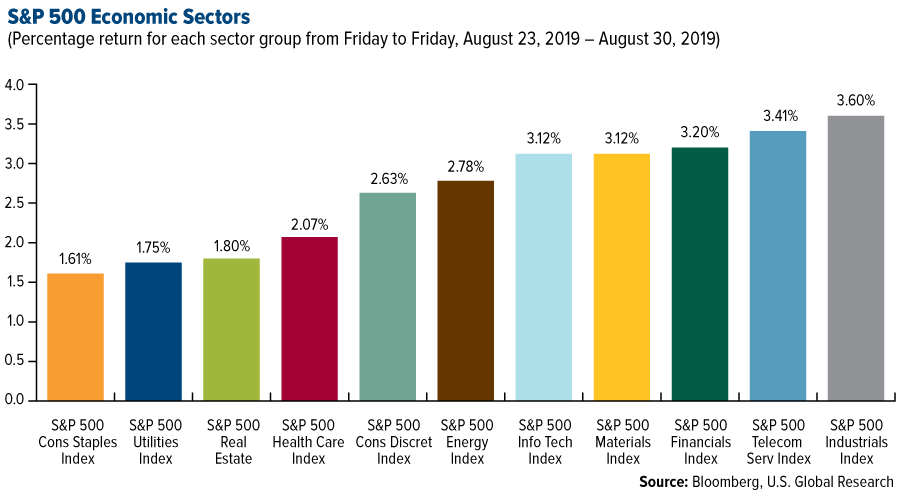
- Industrials was the best performing sector of the week, increasing by 3.60 percent versus an overall increase of 2.65 percent for the S&P 500.
- Dollar General was the best performing stock for the week, increasing 13.94 percent.
- Microsoft won a big victory this week with an $8 billion Pentagon cloud-software contract, reads one Business Insider headline this week. The Defense Enterprise Office Solutions (DEOS) contract was awarded to CSRA LLC and its contractor teaming partners Dell Marketing LP and Minburn Technology Group LLC, companies that all plan to use Microsoft Office 365.
Weaknesses
- Consumer staples was the worst performing sector for the week, decreasing by 1.61 percent versus an overall increase of 2.65 percent for the S&P 500.
- Ulta Beauty was the worst performing stock for the week, falling 26.19 percent.
- Ulta Beauty fell the most in almost 12 years after the retailer posted a rare quarterly earnings miss and slashed its year profit and net sales targets, writes Bloomberg, given weakness in the U.S. cosmetics category. The disappointing report resulted in four sell-side downgrades so far, and a substantial cut to the average 12-month price target.
Opportunities
- Dell Technologies shares jumped on Friday, after the company raised its full-year profit outlook. The results were seen as reassuring at a time when analysts have been concerned about weaker corporate IT spending. Raymond James described Dell as “a nice house in a tough neighborhood” and at least two firms slightly raised their price targets.
- Bank of America Merrill Lynch is bullish on risk assets for 2019, according to Bloomberg, particularly stocks and commodities. Investors’ positioning, as well as dovish monetary policies are giving impetus to the view. The bank’s strategists highlighted that the trade war has so far pushed interest rates lower, rather than triggering a recession.
- Lam Research announced that it would raise its dividend. “It could be a slight hint at an improving memory environment,” RBC analyst Mitch Steves said Friday in a report.
Threats
- Nippon Steel will cut its planned capital expenditures for the three-year period to March 2021, writes Business Insider, by between 10 percent and 20 percent, as weaker steel demand amid the U.S.-China trade war has eroded its profits. Slowing global steel demand for automobiles and machinery, reflecting the trade row and higher material costs, have battered Japanese steelmakers’ quarterly earnings.
- Apple and Samsung phones are reportedly being investigated by the Federal Communications Commission (FCC) for emitting too much radiation, reports Business Insider. Specifically, the Apple iPhone 7 and iPhone 8 — as well as the Samsung Galaxy S8, Galaxy S9, and Galaxy J3 — were found to emit higher levels of radiation than they’re supposed to.
- As the likelihood of Britain crashing out of the European Union without a trading agreement rises, Citigroup estimates that such an event could cut domestic banks’ earnings by as much as 25 percent.
The Economy and Bond Market
Strengths
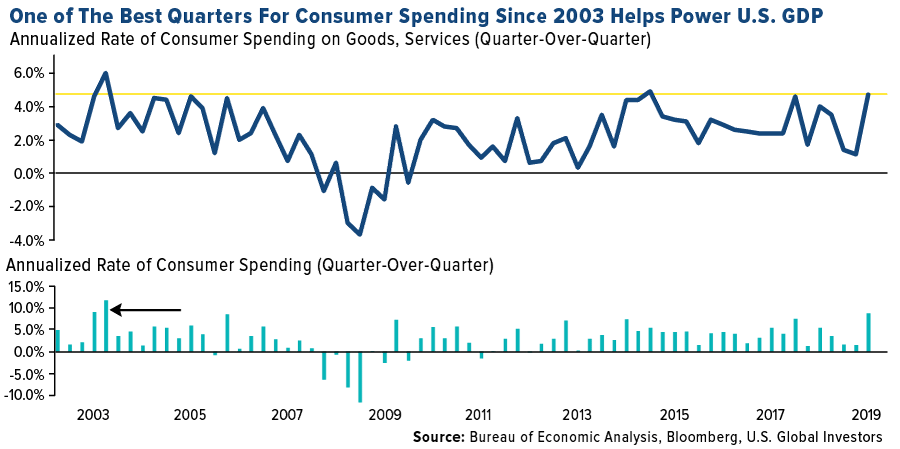
- U.S. personal consumption advanced at a 4.7 percent annualized pace during the second quarter, the quickest since the end of 2014, the Commerce Department’s gross figures show. The advance was led by an 8.8 percent annualized surge in outlays for merchandise, the most in nearly 16 years on more purchases of motor vehicles, recreational goods, apparel and restaurant meals.
- Orders for durable goods rose 2.1 percent in July, the Commerce Department reports. It is the second straight monthly gain. Economists expected a 0.9 percent gain according to the MarketWatch survey. The gain in orders was led by transportation.
- Economic activity in the Chicago area improved more than expected in August, according to figures released on Friday reports MarketWatch. The MNI Chicago business barometer rose to 50.4 this month from 44.4 in July, beating expectations for a reading of 47.5. The index had been in contraction territory for the previous two months.
Weaknesses
- The U.S. economy slowed a bit more than initially forecast in the second quarter, writes CNBC, as a result of declining exports and a smaller inventory build. Gross domestic product increased at a 2.0 percent annualized rate, the Commerce Department said in its second reading of second-quarter GDP on Thursday. That was revised down from the 2.1 percent pace estimated last month, the article continues.
- U.S. consumer sentiment fell the most in six years, writes Bloomberg, slumping to the lowest level of Donald Trump’s presidency as Americans expressed concern about how his tariffs will affect the economy. The University of Michigan’s final sentiment index fell to 89.8 in August from a previously reported 92.1 and 98.4 in July, data showed Friday.
- Pending home sales fell 2.5 percent in July, month-over-month, and were 0.3 percent lower compared with July 2018, according to the National Association of Realtors. “Super-low mortgage rates have not yet consistently pulled buyers back into the market,” said Lawrence Yun, chief economist of the NAR. “Economic uncertainty is no doubt holding back some potential demand, but what is desperately needed is more supply of moderately priced homes.”
Opportunities
- The most important items next week will be on Friday, as investors will be hoping to get more direction from the August jobs report as it could be the deciding factor for some FOMC members in voting for or against a rate cut at the Fed’s September policy meeting. The U.S. labor market is expected to have added 159k jobs in August, signaling that there’s still plenty of momentum in the economy. The unemployment rate is forecast to stay at 3.7 percent, while average hourly earnings are projected to have increased by 3.1percent year-on-year in August.
- The biggest impact from next Thursday’s data could come from the ISM non-manufacturing PMI, which unexpectedly slumped in July. The non-manufacturing PMI is forecast to inch up to 53.8 in August.
- Factory orders on Thursday are forecast to have risen for a second straight month in July.
Threats
- Investors will be looking at key gauges of the U.S. economy next week to assess the chances of a further dovish tilt by Fed policymakers. First up on the radar is the ISM manufacturing PMI. The index is forecast to edge lower by another 0.2 points to 51.0 in August.
- Trump’s new tariffs are about to hammer American wallets — and Goldman Sachs says the U.S. economy may not recover for years. According to Goldman, inflation is expected to rise while real growth is set to fall because of the added tariffs.
- A coalition of more than 150 U.S. trade associations is making a last-ditch plea to postpone new tariffs on goods that take effect Sunday, reports Bloomberg, saying they “come at the worst possible time” and that holiday purchases will still be affected.
Energy and Natural Resources Market
Strengths
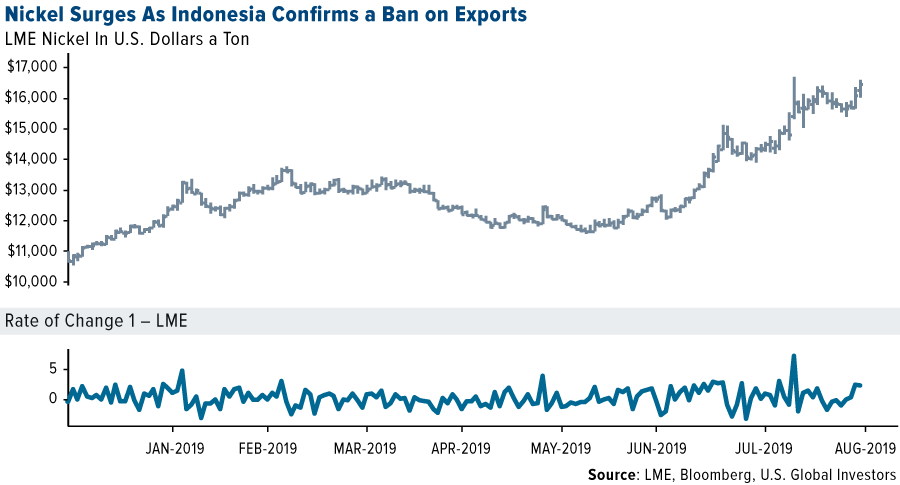
- The best performing major commodity for the week was natural gas, which gained 5.99 percent with a late summer heat wave driving record pipeline flows. Nickel is on a tear this week, and for the year, after Indonesia announced that it will move forward its ban on exports of the metal from the end of December. According to Macquarie Wealth Management, a total ban on nickel ore exports from Indonesia could impact around 10 percent of global supplies and more than double the current deficit. Nickel surged as much as 8.8 percent on the London Metal Exchange to a four-year high. The metal is also up 66 percent so far this year.
- Oil saw its biggest weekly gain in seven weeks due to a big drop in American crude inventories and a slight pause in the U.S.-China trade war. Oil rose as much as 1.6 percent on Wednesday, after rising 2.4 percent on Tuesday, when the American Petroleum Institute said stockpiles fell by 11.1 million barrels last week. On Thursday, China said that it would not immediately retaliate against the U.S. for its latest round of tariffs, which spurred optimism that a deal could be reached. In merger news, PDC Energy agreed to buy its rival SRC Energy for $971 million in stock.
- BloombergNEF reports that regulators in some U.S. states are exploring performance-based metrics for setting a utility’s rate of return. These could incentivize utilities to modernize grids and help achieve clean energy goals. Helen Kou writes that “these policy changes may decrease the revenues of utilities, but could boost returns for those that perform well.”
Weaknesses
- The worst performing major commodity for the week was wheat, which fell 5.05 percent on bigger than expected deliveries against September futures contracts, perhaps foreshadowing more supply to come. Iron fell 28 percent in August, which is its worst month ever, largely due to rebounding supplies. Shipments are picking back up from Brazil and Australia (two top suppliers that saw disruptions in the first half of the year), and there have been growing signs out of China of a slowdown in steel production. Bloomberg reports that BHP Group, the world’s number three iron miner, said last week that prices will be lower in the current financial year amid high volatility.
- De Beers, the world’s biggest supplier of diamonds, sold just $280 million of the gems this month – 44 percent less than a year earlier. In an effort to woo buyers, the company took an unusual step of offering concessions to customers, such as refusal to buy half the stones offered that are small than three quarters of a carat, reports Bloomberg. De Beers’ sales are $1 billion lower so far this year.
- JPMorgan Chase, Goldman Sachs and Glencore are facing a lawsuit from Eastman Kodak claiming that they manipulated the aluminum market after the 2008 financial crisis, reports Bloomberg Law. The three companies control 80 percent of U.S. aluminum warehousing capacity and allegedly inflated the price index through a scheme to create artificial logjams by overloading their warehouses.
Opportunities
- Bullish sentiment is growing for steel demand on the heels of possible infrastructure spending. Tom Gibson, president of the American Iron and Steel Institute, said in an interview this week that politicians might agree on a “robust” highway infrastructure bill during the upcoming election season, which would be very positive for the steel industry. Edward Lehner, CEO of metals and processor and distributor Ryerson, also sees a boost from “massive” infrastructure outlays, reports Bloomberg.
- The world’s largest infrastructure manager, Macquarie Group, plans to raise A$1 billion in a share sale to fund its foray into renewable energy, reports Bloomberg. The company has already invested or arranged more than A$20 billion in green energy projects so far this decade.
- According to BloombergNEF estimates, the world will install 129 gigawatts of new solar capacity in 2019, up from 108 gigawatts in 2018. Although China’s first solar mega-auction was smaller than expected, it still allocated 22.8 gigawatts of new projects to be completed this year or next.
Threats
- Hurricane Dorian is set to hit Florida this weekend and could be the first major hurricane to hit the state in 15 years. Florida’s governor declared a state of emergency in anticipation, as have several counties in Georgia. This could cause flooding and disruptions in the entire region.
- The U.S. Environmental Protection Agency (EPA) unveiled a proposal to eliminate federal mandates that require energy companies to identify and repair methane leaks at oil and gas facilities, reports Bloomberg. Supporters of the measure say that Obama administration efforts went too far in deciding to specifically regulate methane, rather than focusing on conventional pollution. Surprisingly (or not), major oil companies, including BP and Shell, are opposed to the rollback. Shell president Gretchen Watkins said in a statement “We believe sound environmental policies are foundational to the vital role natural gas can play in the energy transition and have made clear our support of 2016 law to regulate methane from new and modified onshore sources.”
- Although progress was made in the trade war this week, tariffs from China on American crude remains a threat. The tariffs set to take effect on September 1 would make oil from the Permian Basin around $3 per barrel more expensive for Chinese buyers. This could lead the country to buy more oil from Europe, where processors are less complex and more suited to turn the lower density and less sulfurous oil into fuels, reports Bloomberg.

Emerging Europe
Strengths
- Greece was the best performing country this week, gaining 4.4 percent. The Prime Minister announced that capital controls will be fully lifted September 1. National Bank of Greece and Alpha Bank reported strong second-quarter results. The banking index gained 11.25 percent over the past five days.
- The Russian ruble was the best relative performing currency this week, losing 1 percent against the U.S. dollar. All emerging Europe currencies declined on souring global investor sentiment; however, the ruble got support from the rebound in the price of oil. Brent crude oil gained 1.9 percent over the past five days.
- The communication service sector was the best performing sector among eastern European markets this week.
Weaknesses
- The Czech Republic was the worst performing country this week, losing 80 basis points. Second-quarter GDP was reported at 0.7 basis points. On a year-over-year basis, the Hungarian economy grew at 2.7 percent, recording slower growth than in the neighboring central emerging European nations.
- The Hungarian forint was the worst performing currency in the region this week, losing 1.7 percent against the U.S. dollar. The central bank held rates steady and highlighted softer domestic inflation, a sign that policymakers remain on dovish footing.
- Finance was the worst performing sector among eastern European markets this week.
Opportunities
- JPMorgan strategists predict a rebound in September, saying it is almost time to buy equities. Quantitative easing by the European Central Bank (ECB), the chance of a second and bigger rate cut by the Fed, along with improving technical indicators are all catalysts that may lift stocks out of the doldrums.
- On Thursday, Bloomberg published an article entitled “There may be a fortune buried in a forgotten corner of Europe,” which pointed to Serbia, formerly Yugoslavia, holding the largest amount of undiscovered lithium in Europe. Global lithium production was up by about 25 percent in 2018, and its production could increase further with higher demand for car batteries. In central Europe, the Czech Republic and Austria are also studying the potential lithium production. Romania is re-opening mines for rare earth-minerals.
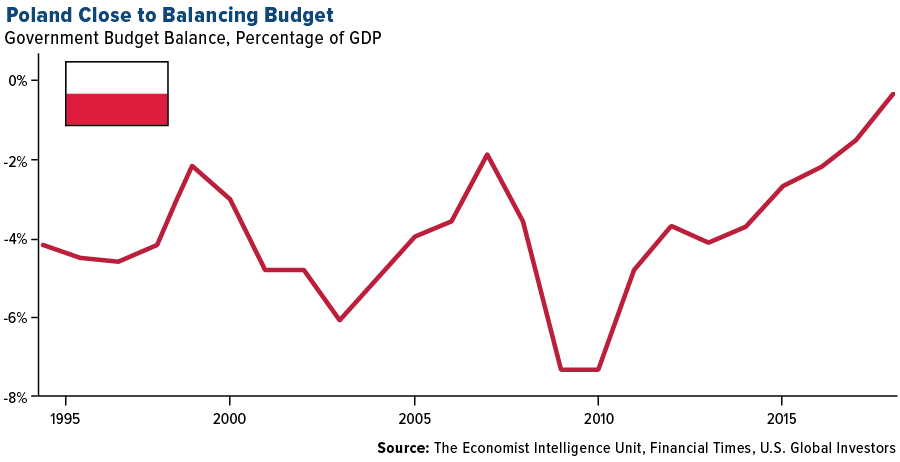
- Poland’s government has proposed the country’s first balanced central government budget in three decades ahead of October’s parliamentary elections. Prime Minister Mateusz Mazowiecki expects government deficit to fall to zero in 2020. GDP is expected to grow at 3.7 percent and most government revenue will come from increased VAT collections.
Threats
- The U.K.’s parliament usually closes for a few weeks in the fall, but just two month before Brexit Boris Johnson, the new prime minister, suspended the parliament from September 9 until October 14. This will squeeze the amount of time lawmakers have to agree on the exit strategy. Boris Johnson has said before that he will take the U.K. out of the eurozone with or without a deal on October 31.
- Bloomberg reported that Germany is bracing for what could be the first outright election victories for the far-right AfD party on Sunday, when voters in two states in the ex-communist east go to the polls. The article notes that the AfD has polled strongly in both Brandenburg and Saxony states, part of its eastern electoral heartland. The article said with Chancellor Merkel’s government already weakening, a poor showing by the ruling parties in Sunday’s vote could eventually strain the coalition beyond repair.
- Banks with high exposure to Swiss franc loans sold off sharply in Poland this week as they could be forced to convert some Swiss franc mortgages into zloty at a rate from the day the loan was granted, (much lower than the current market price). If all franc mortgages would be converted this way, it could cost the banking sector about 70 billion zloty, Trigon Dom Maklerski Sa, an analyst with Maciej Marcinowski, said in a note.
China Region
Strengths
- The best performing indices in the region for the week were India’s NIFTY and SENSEX, up 1.79 percent and 1.72 percent, respectively. The Philippines, Indonesia and South Korea all closed up more than 1 percent as well.
- The best performing sector in Hong Kong’s Hang Seng Composite Index was energy, which climbed 93 basis points for the week.
- South Korea’s year-over-year industrial production beat as the July period saw a 0.6 percent gain, well ahead of an expected drop of 3.2 percent, and up from the prior revised decline of 2.6 percent.
Weaknesses
- The worst performing index in the region was Hong Kong’s Hang Seng Composite Index, which fell 1.51 percent on the week. The city’s protests do appear, based on recent numbers, to be weighing heavily on sentiment, tourism, and retail sales, among other things. Shanghai, Singapore and Vietnam also closed down for the week.
- The poorest performing sector in Hong Kong’s Hang Seng Composite Index this week was telecom, which declined by 2.71 percent, narrowly nudging out properties & construction, which fell 2.64 percent.
- Hong Kong’s year-over-year retail sales plummeted 11.4 percent for July.
Opportunities
- My, my, what a difference a week can make! This time last week President Trump had responded to Chinese escalation with his own announcement of hiking U.S. tariffs even further, upping the cycle of escalation and retaliatory escalation, heating up the rhetoric and making markets dread the coming Monday. Instead, rhetoric was dialed down over the weekend, second thoughts expressed, China eventually announced it does not plan to initiate new counter-tariffs, and, reportedly, multiple (“productive”) phone calls between the various trade teams at some level were held over the course of the week, all culminating in much-improved sentiment by the week’s end. Of course, there’s still the issue of the looming September 1 escalation and we’re always one tweet away from more possible changes, so stay tuned, but a delay in tariff implementation—it’s happened before, hasn’t it?—remains possible, as do face-to-face talks in September and possible boosts to certainty and/or sentiment. Game on.
- Even though the whims of the trade war grab headlines, note carefully (as described also above) that amid them Chinese authorities have announced a series of some 50 various measures slashing taxes and easing restrictions in the Lingang Special Area, part of the Shanghai Free Trade Zone. The total number of free trade zones in the world’s second-largest economy now stands at 18, a Bloomberg News article recently noted, pointing out that “By 2035, Lingang’s GDP is expected to reach one trillion yuan ($140 billion),” which “would match the GDP of Shanghai’s Pudong New Area.” The aim of the investment-luring measures is reportedly to push the area toward becoming a “hub for high-end manufacturing industries such as artificial intelligence, semiconductors, aviation and aerospace,” the Bloomberg article points out.
- We have an update on Indonesia’s new administrative capital: it is to be located in East Kalimantan, on the far east side of Indonesian portion of the island Borneo. The cost for the move is projected to be at least $33 billion, as the government attempts to ease some of the troubles of gridlocked, sinking Jakarta by constructing the new administrative capital. The Indonesian government controls some 180,000 hectares of land in the area, roughly triple the size of Jakarta. And guess what? There’s no official new name for the capital yet. Maybe you can still send in your suggestion!

Threats
- In keeping with this section’s views, we once again reiterate that trade war escalation remains a threat until it isn’t. This week we’ve seen more positive developments and rhetorical overtures, but don’t forget they come on the heels of just the opposite: escalation of rhetoric and announcements of increases on levies from both sides. But which tariffs and at what levels? As long as we’re short of a grand bargain of any kind, those will be the primary questions for the meantime.
- Unrest in Hong Kong continues, with activists like Joshua Wong arrested (since out on bail) ahead of scheduled protests again this weekend. The movement is increasingly described by media sources as relatively broad-based, specifically and frequently described as “leaderless,” and remains extraordinarily anti-Carrie Lam (the Beijing-approved CEO of HK). As already described above and in past weeks of Investor Alert, what HK authorities have called an economic “abyss” may be looming larger all the time as the standoff continues to disrupt commerce and tourism. (Of course, therein may lie opportunity as well—any resolution or progress may yield a solid play on an otherwise beaten-down market….)
- Have you seen the U.S. dollar? It’s pushing new 52-week highs today, which could weigh on emerging markets or sentiment toward the region.
Blockchain and Digital Currencies
Strengths
- Of the cryptocurrencies tracked by CoinMarketCap, the best performing for the week ended August 30 was CREDIT, up 309.19 percent.
- Despite bitcoin enjoying a rather loose relationship with other assets during its brief history, a recent report from Digital Asset Data illustrates that this could be changing. As MarketWatch recaps, bitcoin has moved in tandem with gold over the last three months and swung inversely to moves in the stock market.

- New data from “Crypto Godfather” and CEO of Block Journal magazine shows that bitcoin’s performance has “outstripped mainstream investments in Internet firms since 2010 by 338,433,233 percent,” CoinTelegraph reports. The earliest price data for the popular digital currency dates back to March 2010, when the coin’s value was merely $0.003. That means today’s price point of around $10,000 represents an “astronomical appreciation,” the article continues.
Weaknesses
- Of the cryptocurrencies tracked by CoinMarketCap, the best performing for the week ended August 30 was BlockStamp, down 78.95 percent.
- After diving out of a narrowing price range mid-week, CoinDesk reported on Thursday that bitcoin risks falling to $9,000 in the next 24 hours (and staying there on Friday). According to the article, a weekly close below $9,533 would confirm a double top breakdown on the weekly chart.
- Earlier in the week French cybersecurity authorities shut down a botnet army responsible for crypto-jacking thousands of computers across 140 countries, writes CoinDesk. According to a report by BBC, the botnet head was located in France and was inoculating computers with Monero crypto-jacking software.
Opportunities
- As cryptocurrency volatility continues, bitcoin’s trading range is narrowing, writes Bloomberg, as speculators seek positions on the right side of a potential breakout. An analysis of Bitstamp’s volume-weighted prices over the past month shows optimists crowding into trades when the digital asset is crossing above $10,000, while pessimists are looking to exit when it approaches $12,000.
- Bitcoin continues to perform well, managing to hold above the key $10,000 level in the face of increasing headwinds, writes Bloomberg. However, technical indicators show the price action between the popular digital asset and alternative tokens is nearing its highest correlation this year, the article explains, indicating that a so-called alt season may be on the horizon.
- According to a study from Coinbase published on Wednesday, academic interest in crypto and blockchain is increasing across the board. After looking at the world’s top 50 universities, it was revealed that 56 percent have blockchain or crypto classes available, CoinDesk reports. Just last year that number was 42 percent, meaning the interest continues to increase.
Threats
- Last week Ethereum co-founder Vitalik Buterin warned that the digital ledger behind the supposed better version of bitcoin is running out of capacity, writes Bloomberg. According the tracker Etherscan.io, Ether’s network utilization has spiked into the 90 percent level. “As level increases, transaction costs could follow suit, possibly making potential corporate users hesitate to use Ethereum,” Buterin said.
- Craight Wright, the self-proclaimed inventor of bitcoin under the pseudonym Satoshi Nakamora, is warning that billions of dollars of the cryptocurrency could soon flood the crypto market, reports Bloomberg, after an unfavorable court hearing. Wright said “he has no choice” but to hand over $5 billion to the estate of his late business partner David Kleiman, but investors seem to be taking the alert in stride. “I’m not worried about Craig transferring Bitcoin to Kleiman because I don’t think he has any to transfer,” Ryan Selkis, chief executive officer at crypto researcher Messari Inc., said in an email. “It’s a sideshow, not a real story.”
- The crypto market saw red, reports CoinDesk, as the price of bitcoin dropped more than $600 in a 30-minute time span on Wednesday, falling below $10,000. Other major names like ether, litecoin and XRP also started to fall in value at around the same time as BTC, losing between 5-10 percent alongside bitcoin, the article continues.

Leaders and Laggards
| Index | Close | Weekly Change($) |
Weekly Change(%) |
|---|---|---|---|
| S&P/TSX Global Gold Index | 262.99 | +2.48 | +0.95% |
| Gold Futures | 1,532.70 | -4.90 | -0.32% |
| Natural Gas Futures | 2.28 | +0.13 | +5.95% |
| S&P/TSX VENTURE COMP IDX | 587.82 | +5.87 | +1.01% |
| 10-Yr Treasury Bond | 1.50 | -0.04 | -2.54% |
| Nasdaq | 7,962.88 | +211.12 | +2.72% |
| Oil Futures | 55.07 | +0.90 | +1.66% |
| Hang Seng Composite Index | 3,463.44 | -53.06 | -1.51% |
| S&P 500 | 2,923.89 | +76.78 | +2.70% |
| DJIA | 26,403.28 | +774.38 | +3.02% |
| Korean KOSPI Index | 1,967.79 | +19.49 | +1.00% |
| Russell 2000 | 1,493.90 | +34.42 | +2.36% |
| S&P Energy | 422.09 | +11.41 | +2.78% |
| S&P Basic Materials | 354.28 | +10.74 | +3.13% |
| XAU | 98.98 | +1.20 | +1.23% |
| Index | Close | Monthly Change($) |
Monthly Change(%) |
|---|---|---|---|
| Natural Gas Futures | 2.28 | +0.05 | +2.10% |
| S&P/TSX Global Gold Index | 262.99 | +36.51 | +16.12% |
| 10-Yr Treasury Bond | 1.50 | -0.52 | -25.71% |
| Oil Futures | 55.07 | -3.51 | -5.99% |
| Gold Futures | 1,532.70 | +94.90 | +6.60% |
| S&P 500 | 2,923.89 | -56.49 | -1.90% |
| S&P Energy | 422.09 | -40.38 | -8.73% |
| Hang Seng Composite Index | 3,463.44 | -247.60 | -6.67% |
| DJIA | 26,403.28 | -460.99 | -1.72% |
| Korean KOSPI Index | 1,967.79 | -56.76 | -2.80% |
| Nasdaq | 7,962.88 | -212.54 | -2.60% |
| S&P Basic Materials | 354.28 | -11.26 | -3.08% |
| Russell 2000 | 1,493.90 | -80.70 | -5.13% |
| S&P/TSX VENTURE COMP IDX | 587.82 | -3.84 | -0.65% |
| XAU | 98.98 | +11.34 | +12.94% |
| Index | Close | Quarterly Change($) |
Quarterly Change(%) |
|---|---|---|---|
| Natural Gas Futures | 2.28 | -0.27 | -10.48% |
| 10-Yr Treasury Bond | 1.50 | -0.72 | -32.38% |
| DJIA | 26,403.28 | +1,233.40 | +4.90% |
| Oil Futures | 55.07 | -1.52 | -2.69% |
| S&P 500 | 2,923.89 | +135.03 | +4.84% |
| Gold Futures | 1,532.70 | +228.60 | +17.53% |
| S&P Energy | 422.09 | -17.10 | -3.89% |
| Nasdaq | 7,962.88 | +395.17 | +5.22% |
| Korean KOSPI Index | 1,967.79 | -71.01 | -3.48% |
| S&P Basic Materials | 354.28 | +20.84 | +6.25% |
| Russell 2000 | 1,493.90 | +8.37 | +0.56% |
| Hang Seng Composite Index | 3,463.44 | -152.14 | -4.21% |
| S&P/TSX Global Gold Index | 262.99 | +80.51 | +44.12% |
| S&P/TSX VENTURE COMP IDX | 587.82 | -14.68 | -2.44% |
| XAU | 98.98 | +31.53 | +46.75% |
U.S. Global Investors, Inc. is an investment adviser registered with the Securities and Exchange Commission ("SEC"). This does not mean that we are sponsored, recommended, or approved by the SEC, or that our abilities or qualifications in any respect have been passed upon by the SEC or any officer of the SEC.
This commentary should not be considered a solicitation or offering of any investment product.
Certain materials in this commentary may contain dated information. The information provided was current at the time of publication.
Some links above may be directed to third-party websites. U.S. Global Investors does not endorse all information supplied by these websites and is not responsible for their content.
Holdings may change daily. Holdings are reported as of the most recent quarter-end. The following securities mentioned in the article were held by one or more accounts managed by U.S. Global Investors as of (06/30/2019):
Royal Dutch Shell PLC
BHP Group Ltd
National Bank of Greece SSA
Alpha Bank AE
Franco-Nevada Corp
Wheaton Precious Metals Corp
Royal Gold Inc
*The above-mentioned indices are not total returns. These returns reflect simple appreciation only and do not reflect dividend reinvestment. The Dow Jones Industrial Average is a price-weighted average of 30 blue chip stocks that are generally leaders in their industry. The S&P 500 Stock Index is a widely recognized capitalization-weighted index of 500 common stock prices in U.S. companies. The Nasdaq Composite Index is a capitalization-weighted index of all Nasdaq National Market and SmallCap stocks. The Russell 2000 Index® is a U.S. equity index measuring the performance of the 2,000 smallest companies in the Russell 3000®, a widely recognized small-cap index. The Hang Seng Composite Index is a market capitalization-weighted index that comprises the top 200 companies listed on Stock Exchange of Hong Kong, based on average market cap for the 12 months. The Taiwan Stock Exchange Index is a capitalization-weighted index of all listed common shares traded on the Taiwan Stock Exchange. The Korea Stock Price Index is a capitalization-weighted index of all common shares and preferred shares on the Korean Stock Exchanges. The Philadelphia Stock Exchange Gold and Silver Index (XAU) is a capitalization-weighted index that includes the leading companies involved in the mining of gold and silver. The U.S. Trade Weighted Dollar Index provides a general indication of the international value of the U.S. dollar. The S&P/TSX Canadian Gold Capped Sector Index is a modified capitalization-weighted index, whose equity weights are capped 25 percent and index constituents are derived from a subset stock pool of S&P/TSX Composite Index stocks. The S&P 500 Energy Index is a capitalization-weighted index that tracks the companies in the energy sector as a subset of the S&P 500. The S&P 500 Materials Index is a capitalization-weighted index that tracks the companies in the material sector as a subset of the S&P 500. The S&P 500 Financials Index is a capitalization-weighted index. The index was developed with a base level of 10 for the 1941-43 base period. The S&P 500 Industrials Index is a Materials Index is a capitalization-weighted index that tracks the companies in the industrial sector as a subset of the S&P 500. The S&P 500 Consumer Discretionary Index is a capitalization-weighted index that tracks the companies in the consumer discretionary sector as a subset of the S&P 500. The S&P 500 Information Technology Index is a capitalization-weighted index that tracks the companies in the information technology sector as a subset of the S&P 500. The S&P 500 Consumer Staples Index is a Materials Index is a capitalization-weighted index that tracks the companies in the consumer staples sector as a subset of the S&P 500. The S&P 500 Utilities Index is a capitalization-weighted index that tracks the companies in the utilities sector as a subset of the S&P 500. The S&P 500 Healthcare Index is a capitalization-weighted index that tracks the companies in the healthcare sector as a subset of the S&P 500. The S&P 500 Telecom Index is a Materials Index is a capitalization-weighted index that tracks the companies in the telecom sector as a subset of the S&P 500. The NYSE Arca Gold Miners Index is a modified market capitalization weighted index comprised of publicly traded companies involved primarily in the mining for gold and silver. The Consumer Price Index (CPI) is one of the most widely recognized price measures for tracking the price of a market basket of goods and services purchased by individuals. The weights of components are based on consumer spending patterns. The Purchasing Manager’s Index is an indicator of the economic health of the manufacturing sector. The PMI index is based on five major indicators: new orders, inventory levels, production, supplier deliveries and the employment environment. The S&P/TSX Venture Composite Index is a broad market indicator for the Canadian venture capital market. The index is market capitalization weighted and, at its inception, included 531 companies. A quarterly revision process is used to remove companies that comprise less than 0.05% of the weight of the index, and add companies whose weight, when included, will be greater than 0.05% of the index. Gross domestic product (GDP) is the monetary value of all the finished goods and services produced within a country’s borders in a specific time period, though GDP is usually calculated on an annual basis. It includes all of private and public consumption, government outlays, investments and exports less imports that occur within a defined territory. The University of Michigan Confidence Index is a survey of consumer confidence conducted by the University of Michigan. The report, released on the tenth of each month, gives a snapshot of whether or not consumers are willing to spend money. The NIFTY 50 index is National Stock Exchange of India’s benchmark broad based stock market index for the Indian equity market. Sensex, otherwise known as the S&P BSE Sensex index, is the benchmark index of the Bombay Stock Exchange (BSE) in India. The price-to-book ratio, or P/B ratio, is a financial ratio used to compare a company’s current market price to its book value. A basis point is one hundredth of one percent, used chiefly in expressing differences of interest rates.
