


What’s the Second Best Performing Asset Since 1999?
Date Posted: April 12, 2019
Read time: 52 min
For the 20-year period, gold as an asset class had the second best annualized returns at 7.7 percent, according to JPMorgan. The S&P 500, by comparison, returned only 5.6 percent on an annualized basis, with bonds coming in at 4.5 percent.
By Frank Holmes
CEO and Chief Investment Officer
U.S. Global Investors

This week the world got its first look ever at a black hole, one of those cosmic bodies so supermassive and powerful that not even light can escape its pull. These things literally destroy all matter that comes within their reach, making them the trash compactors of the universe.
Some of you reading this right now can probably point to a few investments you made over the years that had more in common with black holes than you would care to admit.
Gold, I’m happy to say, is not among those investments, despite all the negative press it sometimes gets. The evidence keeps rolling in that the yellow metal has historically been a wise investment. Because it has a negative correlation with the market, gold has helped investors diversify their portfolios and improve their risk-adjusted returns. Back in January, I shared several charts showing how the price of gold has beaten the market over several time periods, including the 21st century (so far).
Take a look at the chart below, using data released earlier this week by JPMorgan. For the 20-year period ended December 31, 2018, gold as an asset class had the second best annualized returns at 7.7 percent. Only REITs (real estate investment trusts) did better at nearly 10 percent.
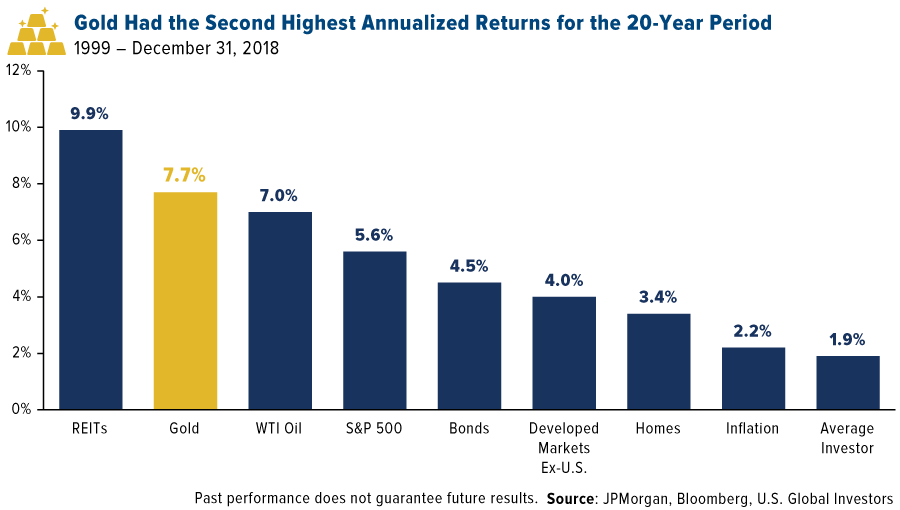
The S&P 500, by comparison, returned only 5.6 percent on an annualized basis, but that’s after it underwent two huge pullbacks that greatly impacted performance. Bonds—which include Treasuries, government agency bonds, corporate bonds and more—came in next at 4.5 percent. Not bad, considering the asset class has lower overall volatility and risk than equities.
In last place is the “average investor” with a lackluster 1.9 percent.
Everyday Investors Have Lagged the Market by a Wide Margin
Surprised? You shouldn’t be. Quantitative analysis of investor behavior, conducted by research firm DALBUR, has shown time and again that everyday retail investors regularly lag the market, in good times and in bad, by an alarmingly wide margin. Last year they lost approximately 9.42 percent, or more than twice as much as the S&P did.
This is due mainly to bad timing. Instead of taking a buy-and-hold approach and riding out short-term volatility, many investors tend to sell at the absolute worst time. And that’s often after missing the rally and buying at the peak.
I shouldn’t have to tell you that this strategy, if it can be called that, is like a “black hole” for your money.
Don’t get me wrong. Trading can be fun and sometimes very profitable. But it’s not investing. If you insist on trading, I think it’s still crucial to maintain a sizeable allocation in high-quality stocks and bonds, exercise discipline and allow your investment to compound over time.
And as always, I recommend the 10 Percent Golden Rule, which you can learn about by clicking here.
Ray Dalio Remains a True Believer in Gold

Ray Dalio, the world’s most profitable hedge fund manager, is a strong believer in the power of gold
Photo by: Harry Murphy/Web Summit via Sportsfile | Attribution 2.0 Generic (CC BY 2.0)
Someone who follows the Golden Rule, with his own and other people’s money, is Ray Dalio, the billionaire founder of the world’s largest and most successful hedge fund firm, Bridgewater Associates. Last year the firm’s flagship Pure Alpha strategy delivered an incredible 14.6 percent gain (compared to “average” investors’ return of negative 9.42 percent, remember). This was not only Bridgewater’s best performance for the year since 2011, but it also helped keep Dalio atop the list of the most profitable hedge fund managers.
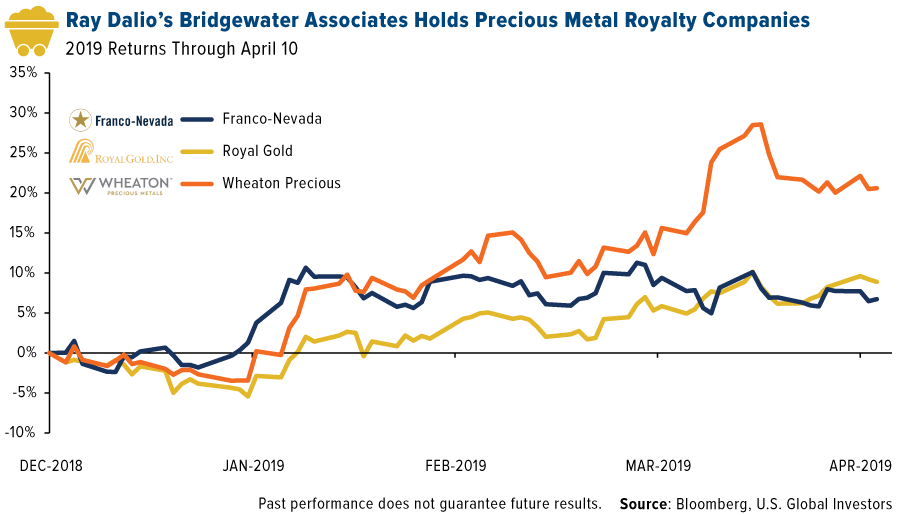
If you drill down into Bridgewater’s SEC filing for the fourth quarter of 2018, you’ll find that Dalio holds significant positions in gold across all tiers in the industry. These positions include physical gold (via SPDR Gold Shares and the iShares Gold Trust), senior gold miners (Barrick Gold, Newmont Mining, Goldcorp, etc.), junior gold miners (Yamana Gold, B2Gold, New Gold, etc.) and gold royalty and streaming companies (Franco-Nevada, Wheaton Precious Metals and Royal Gold).
As many of you know, I like to get access to the precious metal market with royalty companies. Back in January, Paradigm Capital showed that this small group of companies crushed all other tiers in the gold mining industry, delivering an unbelievable 16 percent in compound annual growth from 2004 to 2018. That’s Ray Dalio-caliber performance.
Dalio Sounds Off on Capitalism
While on I’m the topic of Dalio, the multibillionaire recently had some choice words to say about capitalism. In a lengthy post on LinkedIn, which you can read here, Dalio shared his belief that it is no longer working as it should for most Americans. As such, he argues, capitalism must be “reformed.”
In one of the more eye-opening segments of his essay, Dalio says that political divisiveness and the widening “opportunity gap” in the U.S. is creating what he sees as eerie similarities between now and the late 1930s:
Disparity in wealth, especially when accompanied by disparity in values, leads to increasing conflict and, in the government, that manifests itself in the form of populism of the left and populism of the right and often in revolutions of one sort or another. For that reason, I am worried what the next economic downturn will be like, especially as central banks have limited ability to reverse it and we have so much political polarity and populism.
This definitely isn’t cheerful bedtime reading. I’m not asking you to agree with Dalio here—he doth protest too much, methinks—but if his thoughts resonate at all with you, I believe it’s even more reason to make sure you’re invested in gold.
Central Banks Continue to Gobble Up Gold
On a final note, the price of gold crossed above $1,300 an ounce again this week following news that China increased its gold holdings in March for the fourth straight month. The People’s Bank of China raised reserves to 60.62 million ounces, or 1,885 tonnes, as trade tensions between the U.S. and the Asian giant continue to drag on. This puts it on course to overtake Russia and Kazakhstan, the top buyers of the yellow metal in 2018.
China wasn’t alone, however. Global central banks bought a net 51 tonnes of gold in February, the largest monthly increase since October 2018, according to a recent report by the World Gold Council (WGC).
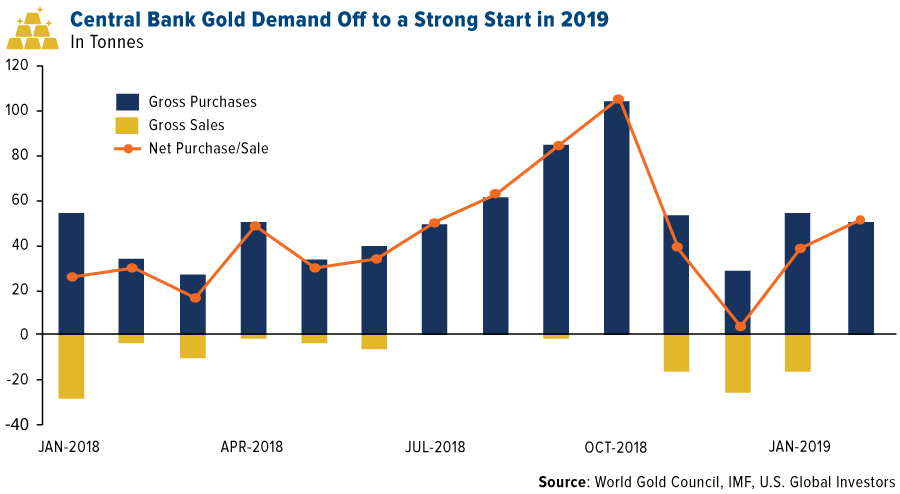
“Central banks’ gold holdings have grown by 90 tonnes in the first two months of the year, compared with 56 tonnes in the same period in 2018 (and the highest level of growth since 2008),” writes the WGC’s Krishan Gopaul. “This shows that collectively, central banks—mostly from the emerging markets—continue to accumulate gold at a healthy pace.”
For even more timely market insight on gold and natural resources, subscribe to my award-winning CEO blog, Frank Talk!

Gold Market
This week spot gold closed at $1,290.35 down $1.40 per ounce, or 0.11 percent. Gold stocks, as measured by the NYSE Arca Gold Miners Index, ended the week lower by 0.93 percent. The S&P/TSX Venture Index came in off 0.66 percent. The U.S. Trade-Weighted Dollar fell 0.45 percent.
| Date | Event | Survey | Actual | Prior |
|---|---|---|---|---|
| Apr-8 | Durable Goods Orders | -1.6% | -1.6% | -1.6% |
| Apr-10 | ECB Main Refinancing Rate | 0.00% | 0.00% | 0.00% |
| Apr-10 | CPI YoY | 1.8% | 1.9% | 1.5% |
| Apr-11 | Germany CPI YoY | 1.3% | 1.3% | 1.3% |
| Apr-11 | PPI Final Demand YoY | 1.9% | 2.2% | 1.9% |
| Apr-11 | Initial Jobless Claims | 210k | 196k | 204k |
| Apr-16 | Germany ZEW Survey Current Situation | 8.5 | — | 11.1 |
| Apr-16 | Germany ZEW Expectations | 0.5 | — | -3.6 |
| Apr-16 | China Retail Sales YoY | 8.4% | — | — |
| Apr-17 | Eurozone CPI Core YoY | 0.8% | — | 0.8% |
| Apr-18 | Initial Jobless Claims | 206k | — | 196k |
| Apr-19 | Housing Starts | 1230k | — | 1162k |
Strengths
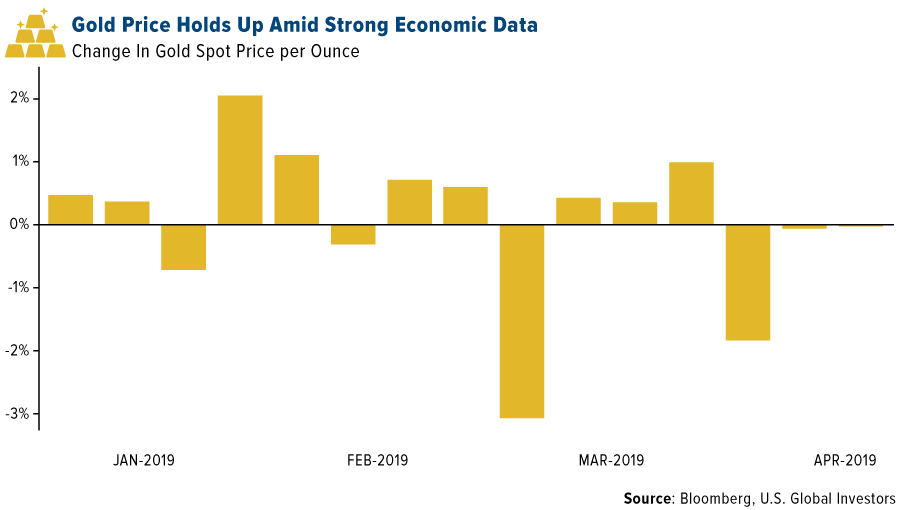
- The best performing metal this week was palladium, up 0.24 percent as hedge funds cut bullish positioning to a six-month low, perhaps resetting expectations. Gold traders turned heavily bullish this week after being neutral last week as the Federal Reserve signaled interest rates will be on hold, according to the weekly Bloomberg survey. China is on a four-month gold buying spree after raising reserves to 60.62 million ounces in March from 60.26 million ounces in February. The nation’s continued purchases of gold are boosting investor sentiment that central banks globally will keep adding to reserves. The yellow metal has held up quite well this week despite stronger-than-expected U.S. economic data trimming gains.
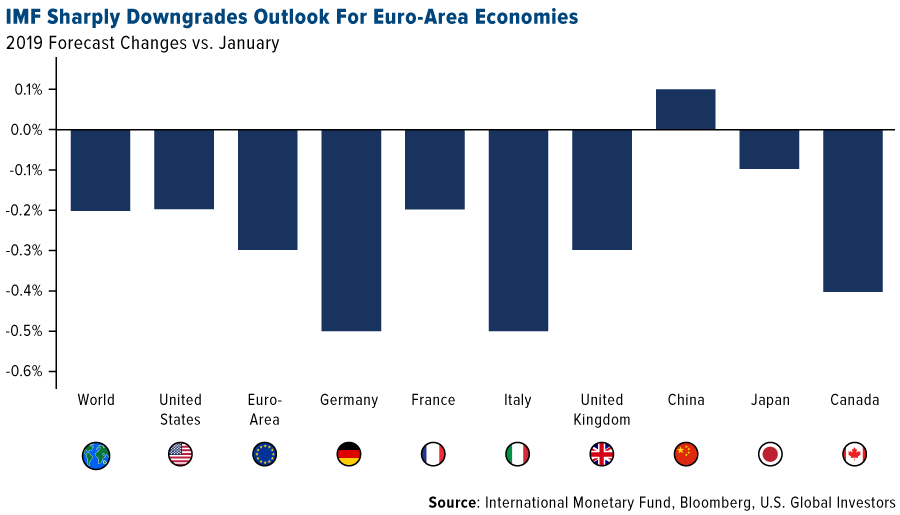
- The International Monetary Fund (IMF) cut its outlook for global growth to the lowest since the financial crisis, which could boost investor demand for safe haven assets. Gold rose to a near two-week high on the news.
- Google Pay is launching gold buying in India. Google has partnered with bullion refiner MMTC-PAMP India to allow users to buy and sell 99.99 percent 24 karat gold through its mobile app in the country. India is the world’s second largest consumer of gold.
Weaknesses
- The worst performing metal this week was platinum, down 1.07 percent, which is ironic as hedge funds boost their bullish positioning to a 13-month high. Commodity ETFs continue to see outflows this week. Precious metals ETFs in particular have seen big outflows with $129 million in losses this week on top of $943 million in outflows the previous week. Investors are becoming impatient with gold and are instead putting their money into the stock market, which has rallied 15 percent this year, compared with just a 1.2 percent gain for the yellow metal. Agnico Eagle CEO Sean Boyd said that global generalist investors have not returned to the gold mining space yet, but they are taking meetings, doing their homework, and likely waiting for gold to break out to the $1,360-$1,370 per ounce range before jumping in.
- Turkey’s gold reserves fell $207 million from the previous week to bring its total holdings to $20.6 billion for the week ended April 5, according to central bank data from Ankara. Bloomberg reports that money managers are fleeing the palladium market and that holdings are to the lowest since October. This is likely due to the threat of President Trump closing the U.S.-Mexico border that would hurt the auto industry, which is a top market for palladium.
- South Africa’s gold production has now fallen for a seventeenth straight month in February, which is the longest run of contractions since the financial crisis, according to data from Statistics South Africa.
Opportunities
- Oliver Allen of Capital Economics writes that the group expects the S&P 500 to drop by roughly one-fifth in 2019 and that gold will come to the fore again as a safe haven asset. The research firm forecasts gold to rally to $1,400 per ounce by the end of the year. AO Chong of CITIC Securities cites a number of risk events that should bring gradual haven demand up for gold. The analyst says the IMF cutting global economic growth outlooks, rising geopolitical uncertainty, the downward trend of real interest rates and the continued central bank gold buying should all be positive for the yellow metal.
- Anglo American Platinum CEO Chris Griffith said at a conference this week that the platinum industry cannot boost output on rising prices and that investors should expect the deficit to remain. Griffith cites unreliable and costly power supply and higher tariffs as the main threats to South Africa’s mining industry, which is a substantial producer of the precious metal. Johann Wiebe, an analyst at GFMS, said in a phone interview this week that silver is seen averaging $16.75 per ounce this year, up from $15.71 per ounce last year.
- Successful investing may require you to think outside the box. As investors have learned, the market tends to do that one thing that disappoints the most investors. When it comes to gold mining ETFs, two products have dominated the space: the VanEck Vectors Gold Miners ETF and the VanEck Vectors Junior Gold Miners ETF with $9.95 billion and $3.83 billion, respectively, in assets. The problem is that now investors have anchored their money to passively managed ETFs that have no view on what is going to happen with regard to consolidation in the sector. If one company gets taken over by another, investors will likely own more of the buyer than the takeout candidate, as a natural function of company size. This could mean the delivery of suboptimal performance. In the gold mining sector, there are a number of mutual funds that have significantly outperformed the two gorillas in the room, despite their higher expense ratios. And in referring to these two ETFs as gorillas, let that not be mistaken for disrespect; there are no actively managed gold mining mutual funds that come close to the size of these two behemoths. There in is the problem, “If everyone is thinking alike, then somebody isn’t thinking,” — George S. Patton
Threats
- Marko Kolanovic, global head of macro quantitative and derivatives research at JPMorgan Chase & Co., says that a negative feedback loop between volatility and liquidity is the reason for topsy-turvy markets. “As volatility rises, market depth declines exponentially, exacerbating price moves,” he said. This can make markets more vulnerable to price spikes. For concentrated bets where everybody owns the same group of stocks this can be a problem.
- Bloomberg writes that quant strategies for picking stocks have misfired as the market rally has driven up the cost of safety. Factors such as investing based on share attributes like profitability and market capitalization are behaving in similar ways but these are vastly different factors. “The market isn’t going up because of cyclical reasons, the market is going up because there’s no alternative in bonds. We’re in a mechanical bull market, not a growth bull market,” said Lode Devlaminck, managing director of global equities at DuPont Capital Management.
- Goldman Sachs strategists led by David Kostin explored what the world would look like without stock buybacks, as the political scrutiny of the practice grows. Federal Reserve data shows that net buybacks averaged $420 billion annually since 2010, while demand from households, mutual funds, pension funds and foreign investors was less than $10 billion for each category. “Repurchases have consistently been the largest source of U.S. equity demand. Without company buybacks, demand for shares would fall dramatically,” the strategists wrote in a note.

Index Summary
- The major market indices finished mixed this week. The Dow Jones Industrial Average lost 0.05 percent. The S&P 500 Stock Index rose 0.51 percent while the Nasdaq Composite climbed 0.57 percent. The Russell 2000 small capitalization index gained 0.14 percent this week.
- The Hang Seng Composite gained 0.23 percent this week; while Taiwan was up 0.94 percent and the KOSPI rose 1.08 percent.
- The 10-year Treasury bond yield rose 6 basis points to 2.561 percent.
Domestic Equity Market
Strengths
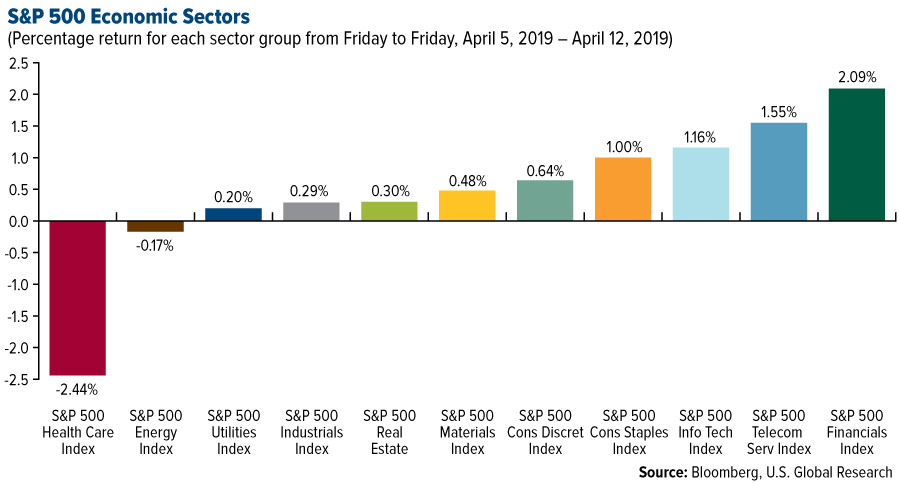
- Financials was the best performing sector of the week, increasing by 2.09 percent versus an overall increase of 0.51 percent for the S&P 500.
- Anadarko Petroleum was the best performing stock for the week, increasing 31.42 percent.
- Chevron announced it will buy Anadarko Petroleum for $33 billion as it seeks more growth from deep-water exploration in the gulf and in the Permian Basin.
Weaknesses
- Health care was the worst performing sector for the week, decreasing by 2.44 percent versus an overall increase of 0.51 percent for the S&P 500.
- Anthem was the worst performing stock for the week, falling 13.79 percent.
- Netflix shares tumbled as news broke that the streaming video service’s $13.99 monthly subscription cost will soon be undercut by Disney’s streaming service at $6.99 per month.
Opportunities
- Uber filed to go public. Shares will list on the New York Stock Exchange and trade under the ticker UBER. The ride-hailing giant did not give a price at which it plans to list its shares but is looking for a valuation of around $100 billion.
- JPMorgan reports record earnings and revenue. The Wall Street bank announced earnings of $2.65 a share on revenue of $29.85 billion.
- PagerDuty soared in its trading debut. Shares of the cloud-computing company surged 59 percent in their New York Stock exchange inauguration on Thursday.
Threats
- We could be looking at our first earnings recession in three years. First quarter earnings for the S&P 500 are forecast to fall 4.2 percent year-over-year, and second quarter earnings are expected to slide 0.3 percent, according to a FactSet analysis.
- Boeing shareholders are suing the company. Shareholders filed a lawsuit in a Chicago court, alleging that the company "effectively put profitability and growth ahead of airplane safety and honesty," according to Reuters.
- Lyft has had an atrocious time since its IPO. Shares have slumped 30 percent since they began trading in late March, and they’re now trading similar to the way Facebook’s did after its IPO.
The Economy and Bond Market
Strengths
- Initial claims for state unemployment benefits fell 8,000 to a seasonally adjusted 196,000 for the week ended April 6, the lowest level since early October 1969. Claims have now declined for four straight weeks.
- U.S. consumer prices increased by the most in 14 months in March, but underlying inflation remained benign against the backdrop of slowing domestic and global economic growth. The Labor Department said on Wednesday its Consumer Price Index (CPI) rose 0.4 percent, boosted by increases in the costs of food, gasoline and rent. That was the biggest advance since January 2018. In the 12 months through March, CPI rose 1.9 percent.
- The NFIB Small Business Optimism Index increased to 101.8, 0.1 points above February’s reading. This is a historically strong level. 23 percent of business owners surveyed said the next three months was a good time to expand.
Weaknesses
- The International Monetary Fund cut its outlook for global growth to the lowest since the financial crisis amid a bleaker outlook in most major advanced economies and signs that higher tariffs are weighing on trade. The world economy will grow 3.3 percent this year, down from the 3.5 percent the IMF had forecast for 2019 in January. The 2019 growth rate would be the weakest since 2009, when the world economy shrank. This is the third time the IMF has downgraded its outlook in six months.
- Consumers’ outlook on the U.S. economy worsened in April, as a survey suggested the impact of tax cuts has now run its course for American households. The University of Michigan said Friday its preliminary index of consumer sentiment was 96.9 this month, down from March’s final reading of 98.4.
- Factory orders in the U.S. fell in February for the fourth time in five months, reflecting a slowdown in the economy that began late in 2018 and carried on through early 2019. Orders dropped 0.5 percent in the month, the government said Monday. Economists polled by MarketWatch had forecast a 0.4 percent decline.
Opportunities
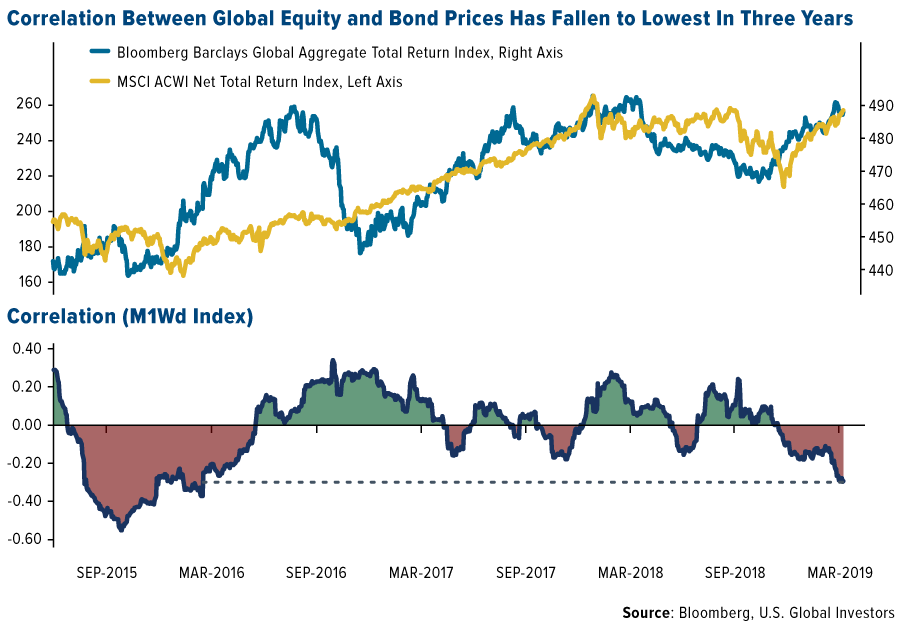
- While this year’s positive relationship between U.S. equity and Treasury returns has been unnerving some fund managers, on a global basis the trend is the opposite. The 90-day correlation between the Bloomberg Barclays Global Aggregate Total Return Index and the MSCI AC World Total Return Index has fallen to its lowest since March 2016, according to data compiled by Bloomberg. The decline is a boon for investors looking for opportunities to diversify, as concern grows about the outlook for the global economy.
- Chinese GDP data next week will provide an update on the health of the world’s second-largest economy. Investors will be analyzing whether the recent bout of stimulus is starting to flow through the economy.
- March retail sales come out next Thursday. The sales figures will be key in assessing the health of the U.S. economy. Sales are forecast to have returned to growth in March after a surprise drop in February.
Threats
- Next week, April manufacturing activity data will give a glimpse of the economic health of the U.S. and Eurozone. Dismal March readings from both were taken as ominous signs for the global economy as international trade tensions hurt factory output.
- Economic growth won’t last as the U.S. labors under the burden of growing entitlement programs and weakness around the world, former Federal Reserve Chairman Alan Greenspan told CNBC. The long-time central bank chief repeated his warnings about the weight that Social Security, Medicare and other programs are having on what have been otherwise solid gains over the past few years.
- With global growth already slowing down, starting a trade war now between the U.S. and the European Union would be both a political and economic mistake, French Finance Minister Bruno Le Maire said Thursday. That warning came in response about whether Le Maire felt worried that the next leg of a global trade war will center on the U.S. and the EU.
Energy and Natural Resources Market
Strengths
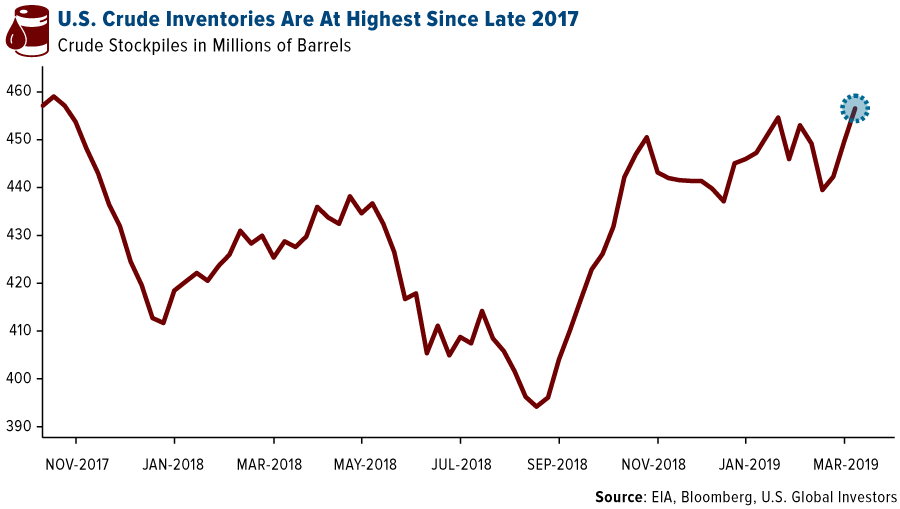
- The best performing major commodity for the week was copper, which gained 1.54 percent on upbeat credit and trade data out of China. Oil is headed for a sixth weekly gain as falling OPEC production tightened global crude markets and offset concerns of slowing economic growth weakening demand. Oil is also still rising despite U.S. inventories hitting the highest level since late 2017.
- Bloomberg News reports that China’s National Energy Administration issued guidelines on how subsidy-free solar and wind power projects will be prioritized. After the government heavily subsidized renewable projects for years, it is now moving toward a market-driven approach to encourage investment.
- Global LNG imports totaled 30.4 million metric tons in March, up 9.9 percent from February, according to BloombergNEF. Europe beat Japan to become the biggest recipient of LNG with 8.3 million metric tons of imports. Chevron is making a $33 billion bet on the Permian shale-oil region and LNG by agreeing to buy Anadarko Petroleum Corp. This purchase will intensify the company’s battle with Exxon Mobil to become the U.S.’s top energy company.
Weaknesses
- The worst performing major commodity for the week was palm oil, which fell 4.27 percent as Malaysian inventories dropped less that the market was expecting. Nickel heads for its biggest weekly loss in eight weeks as sluggish global growth prospects and a potentially drawn-out U.S.-China trade war weighs on industrial metal prices, writes Bloomberg’s Swansy Afonso. A trade war resolution is yet to be finalized while trade tensions heated up between the U.S. and the European Union this week.
- Bloomberg writes that by the end of last year, natural gas producers in the Permian basin were burning off enough of the fuel to meet the residential demand across the whole of Texas. Production is booming, yet pipeline infrastructure has not kept pace, and producers are often left with no choice but to burn off the gas since there is nowhere to send it.
- Bloomberg writes that copper traders are lying in wait for a resolution to the U.S.-China trade war, as the metal hasn’t had any exciting price swings in the last few weeks. Many in the industry can agree that miners aren’t producing enough copper and that there will be a supply deficit. However, others are concerned about China’s economy, which accounts for around half of the world’s consumption of the metal. Freeport-McMoRan Inc., the world’s largest publicly traded copper producer, has said that it will not invest in new projects until the trade war and global economic growth uncertainty is resolved. On the other hand, Rio Tinto still sees strong demand drivers for copper despite negative trade war headlines.
Opportunities
- One of the world’s biggest investors, Legal & General Group PLC, has modeled the climate crisis and sees both risk and opportunity, writes Bloomberg. “The cost of transformation will be much more manageable than many people think,” said Nick Stansbury, head of commodities research at the company’s investment management unit. The company believes that the fight against climate change will make emerging economies more robust and that profits will be higher if politicians in the U.S. finally act on limiting an increase in global temperatures.
- U.S. uranium miners could be in for some good news. Energy Fuels Inc. and Ur-Energy Inc., two small uranium miners, asked the Trump administration to require U.S. power plants and other users to get at least 25 percent of their uranium fuel from domestic sources as a matter of national security, writes Bloomberg’s Ari Natter. A report from the White House is due on Sunday and the miners are optimistic that it will result in a good outcome.
- The iron bulls are out this week after news that a supply shock is building. Vessel-tracking data from GlobalPorts shows that there was a steep decline in the number of cargoes being loaded from Brazil following Vale SA’s damn disaster in January. Additionally, exports from top exporter Australia fell to 3.4 million tons in the week to April 5. Citigroup Inc.’s head of commodities research Ed Morse said in a Bloomberg TV interview that they see iron ore rising to $100 per ton over the next three months due to transit of the metal being very slow.
Threats
- China, the world’s biggest producer and consumer of coal, is set to lift output by more than 100 million tons in 2019, according to the China National Coal Association. More domestic production means China is importing less from overseas. Imports dropped to 23.5 million tons in March, down from 26.7 million a year earlier. Another party joined the growing global retreat from funding fossil fuel projects. Poland’s biggest state-controlled banks are moving away from providing funding to miners and utilities that generate most of their power by coal.
- South Africa’s power shortages could continue to worsen. According to government estimates, Eskom Holdings, which supplies most of the nation’s power, will lose more than a quarter of its current generating capacity over the next ten years as it closes aging coal-fired plants. Bloomberg writes that the cost to replace output and add capacity to meet demand will take many years and cost more than $1 trillion.
- Big oil companies are ready to make big investments into new gas export projects, but there is concern over who will build these projects and for how much. As much as $144 billion of investments in new LNG developments are in line to be approved by the end of 2019. However, there might not be enough engineering, procurement and construction companies to help build. Saul Kavonic, energy analyst at Credit Suisse Group AG, said that “we have a new wave of LNG projects coming and a decimated construction sector.”

Emerging Europe
Strengths
- Hungary was the best performing country this week, gaining 2.6 percent. OTP Bank was the strongest contributor to the Budapest equites’ outperformance. The bank announced plans to acquire three more banks in the region, and also announced its biggest IT project in the past 20 years.
- The Russian ruble was the best performing currency this week, gaining 1.5 percent against the U.S. dollar. Higher oil prices are supporting the currency. In addition, after the European Central Bank (ECB) left its policy rates unchanged and reconfirmed additional stimulus, Russia placed more than 137 billion rubles of 10- and 5-year bonds, taking advantage of high domestic rates. The bond issuance was oversubscribed, signaling investors’ strong appetite for Russian bonds, with total investors demanding 200 billion rubles.
- Financials was the best performing sector among eastern European markets this week.
Weaknesses
- Turkey was the worst performing country this week, losing 2.4 percent. Political uncertainty seized Istanbul after local elections failed to secure a clear winner. President Erdogan is now demanding an annulment of the election, followed by a new vote. Moreover, president Erdogan met president Putin on Monday in Moscow, and Tukey confirmed taking delivery of the Russian defense system later in the summer. This could create further tension between the United States and Turkey, both members of NATO.
- The Turkish lira was the worst performing currency this week, losing 2.6 percent against the U.S. dollar. Bloomberg reports that the cost to hedge against Turkey risk is rising just as borrowers face a wall of debt maturities this quarter. Four Turkish banks each have more than $1billion in foreign debt payments due in the next three months. Many brokers suggest that economic reforms proposed by the government this week may not be enough to support the domestic economy.
- Industrials was the worst performing sector among eastern European markets this week.
Opportunities
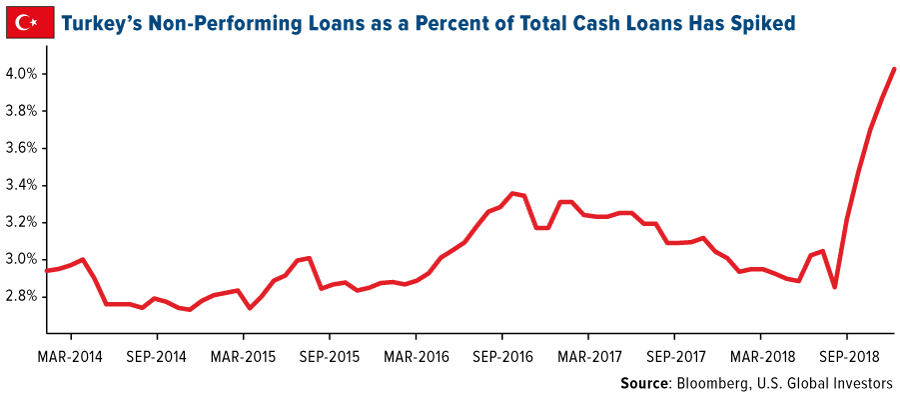
- The Turkish government announced a new reform program regarding the banking sector, tax reform, tourism, agriculture, social security reform and a special focus on the battle with inflation. The most important part of the package focuses on the banking sector. The Treasury will issue government bonds amounting to 28 billion lira ($4.9 billion) and give them to state banks to bolster their capital adequacies. The government is also planning to set up a fund that will take on bad debt; this should help banks lower their exposure to non-performing loans that have spiked recently.
- The ECB believes that monetary accommodation is still necessary to bring inflation higher. President Mario Draghi said the implementation of structural reform should be substantially stepped up to increase resilience and to boost the European Union (EU) area’s productivity and growth potential. Bank left all rates unchanged, with expectation that they will stay at the current low level longer.
- Brexit will not happen this weekend. The EU Council granted an extension for the Brexit deadline to October 31, 2019. The U.K. should indicate by May 23 whether it has made a decision on next steps. The U.K. will also have to participate in the European elections if it wants to use the full length of the extension, otherwise it will have to leave on June 1. This does not provide clarity of the Brexit process, but for now, the U.K. has avoided a chaotic exit from the eurozone, previously scheduled for April 12.
Threats
- The International Monetary Fund (IMF) lowered its 2019 global growth forecast from 3.5 percent to 3.3 percent. The growth forecast of European countries was revised down the most. The IMF sated that the lower expectations are due to “trade tensions and tariff hikes between the United States and China, a decline in business confidence, a tightening of financial conditions and higher uncertainty across many economies”.
- The U.S. is proposing tariffs on $11billion of imports from Europe including cheese, wines, motorcycles and passenger helicopters. The action stems from a World Trade Organization ruling that stated the EU illegally subsidized airplane-maker Airbus, creating an unfair trade advantage. “The EU has taken advantage of the U.S. on trade for many years,” President Trump tweeted on Tuesday morning. “It will soon stop!”
- According to a Gallup survey, 44 percent of Russians aged 15-29 want to emigrate as their economy stagnates. Among those aged 30-45, 22 percent wanted to move abroad permanently. The most sought-after destinations overall were Germany and the Unites States. For now, a higher oil price is supporting the country’s revenue, but when the oil price corrects equites trading on the Moscow exchange and the country’s revenue will follow the price of Brent crude oil. In addition, the threat of new sanctions coming from the United States is still in the air.
China Region
Strengths
- Korea’s KOSPI closed up 1.08 percent, Thailand’s SET Index rose 1.03 percent, and Hong Kong’s HSCI finished up 23 basis points.
- Information technology was the top performing sector in Hong Kong’s Hang Seng Composite Index for the week, rising 3.87 percent.
- China’s exports beat expectations for the March measurement period, rising 14.2 percent year-over-year and rebounding from the prior month’s decline.
Weaknesses
- The Shanghai Composite fell by 1.78 percent, while Indonesia’s Jakarta Composite fell 1.05 percent, and Malaysia’s KLCI dropped by 71 basis points.
- Conglomerates ended up the worst performing sector in Hong Kong’s Hang Seng Composite for the week, dropping by 1.79 percent.
- Singapore’s retail sales dropped 10.0 percent year-over-year for the February period.
Opportunities
- This week Hong Kong’s blue chip Hang Seng Index jumped up to the third-largest globally, behind the United States and China, but ahead of Japan.
- A resolution perceived as positive by markets to the U.S.-China trade spat may provide more impetus to global and regional markets. While there were no major public developments in the trade talks this week, they remain ongoing.
- Global investors’ holdings of Chinese bonds continues to grow, a recent Bloomberg News story highlighted, and starting April 1 this year, the Bloomberg Barclays Global Aggregate Index started its phase-in of Chinese sovereign bonds and debt sold by key state-owned policy banks. The article highlights that Morgan Stanley sees as much as $120 billion going into China’s government bond market annually between 2020 and 2030.

Threats
- U.S.-China trade talks remain ongoing and tariffs remain delayed in implementation; a collapse of the former or the commencement of the latter remain a collective threat until resolution one way or the other amid the dispute. This week there were promising signs—a new consensus, if you will—but of course, it’s not over yet.
- Elections are coming up in Indonesia and have already started in India. While both Indonesia’s Joko Widodo and India’s Narenda Modi are expected to hold power, the last few years, if you’ll recall, have occasionally seen the odd global vote with supposedly foregone conclusions get thrown for a loop. And of course, sometimes the devil is in the details (see also: Brexit) after the election dust settles, or in how the balance of power is affected, or in what direction the government leans afterwards. So again, while the status quo is expected to continue in both countries’ cases, stay tuned.
- The U.S. dollar remains strong, which could possibly weigh on or spook emerging markets at some point. The dollar has not yet broken out to new 52-week highs, and the Fed remains in “pause” mode, but the U.S. has not yet ruled out further hikes. The dollar remains strong in the meantime.
Blockchain and Digital Currencies
Strengths
- Of the cryptocurrencies tracked by CoinMarketCap, the best performing for the week ended April 12 was SuperEdge, up 1,686 percent.
- On Wednesday, cryptocurrency prices continued to move higher, taking the market value of all digital assets above $180 billion for the first time in more than four months, reports Bloomberg. Some of the biggest gains midweek were seen in altcoins. For example, Bitcoin Cash gained over 100 percent in 36 hours to reach an intraday high at $348, the article continues.
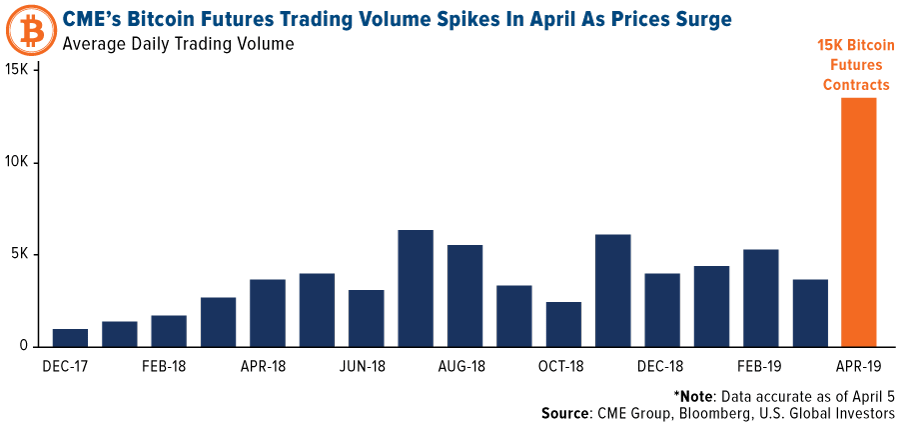
- The bitcoin futures market is seeing a boost as the resurgence in the price of the popular digital currency has gone up this month as well, reports Bloomberg. In fact, CME Group’s bitcoin futures hit a record 22,542 contracts traded on April 4, according to a release from the derivatives exchange operator. That is equivalent to 112,710 bitcoin with a notional value of $546 million.
Weaknesses
- Of the cryptocurrencies tracked by CoinMarketCap, the worst performing for the week ended April 12 was Happycoin, down 73.06 percent.
- China’s National Development and Reform Commission (NDRC), in charge of formulating macroeconomic policies, published a draft proposal revising its existing Catalog for Guiding Industry Restructuring, reports CoinDesk. In the publication, the government agency labeled bitcoin mining as an “undesirable” industry, saying it should be discontinued in the country’s future development.
- On Wednesday, the New York Department of Financial Services (NYDFS) rejected cryptocurrency exchange Bittrex’s application for a BitLicense, reports CoinDesk, the first such action in two years. Although the regulator previously issued several deficiency letters since Bittrex first submitted an application, a number of concerns remained unaddressed. A letter published by the NYDFS went into detail saying that the exchange’s “current policies and procedures are either non-existent of inadequate.”
Opportunities
- A broader range of investors will now be able to participate on the Bitfinex cryptocurrency exchange, reports CoinDesk, as the group removes its $10,000 minimum equity requirement to start trading. “We simply could not ignore the increasing level of requests for access to trade on Bitfinex from a wider cohort than our traditional customer base,” wrote CEO Jean-Louis van der Velde.
- The Token Taxonomy Act was reintroduced on Tuesday by U.S. representative Warren Davidson, reports CoinDesk, as lawmakers seek to exempt certain cryptocurrencies and other digital assets from federal securities laws, allowing individuals to more easily trade or transact with select coins. The bill, which was first introduced last year, “would amend the Securities Act of 1933 and the Securities Exchange Act of 1940, granting regulators such as the U.S. SEC clarity on how they may enforce securities laws surrounding cryptocurrencies,” the article explains.
- At this week’s Forbes CIO Summit, the topic of discussion centered on the implementation of blockchain technology by large enterprises as a secure way to track goods. Although mass utilization could be years away, Oracle’s group vice president of blockchain product development Frank Xiong is positive on the rate of adoption. “My projection is that between 50 percent and 60 percent of companies will use blockchain in the next few years,” Xiong commented.
Threats
- A new type of cyberattack, known as “privacy poisoning,” is threatening to render blockchain technology unusable, some experts warn. The attack involves “poisoning” a blockchain by loading it with sensitive or illicit content, putting it in conflict with local laws. Consequentially, the affected chain would not be able to be used without first scrubbing it of the offending data, an expensive and time-consuming task.
- Technical data appears to show that bitcoin is at its most overbought level since at least December 2017, when the cryptocurrency hit its all-time high of nearly $20,000. As was the case then, today’s trading pattern could signal a heavy selloff.
- A young bitcoin seller from the U.S. has been ordered to forfeit over $800,000 gained illegally via an unlicensed money transmission business, writes CoinDesk. On Monday it was announced by the Attorney’s Office of the Southern District of California that the dealer, Jacob Burrell Campos, has also been sentenced to two years in jail.

Leaders and Laggards
| Index | Close | Weekly Change($) |
Weekly Change(%) |
|---|---|---|---|
| S&P/TSX Global Gold Index | 193.45 | -3.68 | -1.87% |
| Gold Futures | 1,294.20 | -1.40 | -0.11% |
| Natural Gas Futures | 2.65 | -0.01 | -0.45% |
| S&P/TSX VENTURE COMP IDX | 625.64 | -4.17 | -0.66% |
| 10-Yr Treasury Bond | 2.56 | +0.06 | +2.60% |
| Nasdaq | 7,984.16 | +45.47 | +0.57% |
| Oil Futures | 63.81 | +0.73 | +1.16% |
| Hang Seng Composite Index | 4,021.29 | +9.10 | +0.23% |
| S&P 500 | 2,907.41 | +14.67 | +0.51% |
| DJIA | 26,412.30 | -12.69 | -0.05% |
| Korean KOSPI Index | 2,233.45 | +23.84 | +1.08% |
| Russell 2000 | 1,584.80 | +2.24 | +0.14% |
| S&P Energy | 499.60 | -0.85 | -0.17% |
| S&P Basic Materials | 363.77 | +1.74 | +0.48% |
| XAU | 75.78 | -1.06 | -1.38% |
| Index | Close | Monthly Change($) |
Monthly Change(%) |
|---|---|---|---|
| Natural Gas Futures | 2.65 | -0.17 | -5.96% |
| S&P/TSX Global Gold Index | 193.45 | -3.81 | -1.93% |
| 10-Yr Treasury Bond | 2.56 | -0.06 | -2.33% |
| Oil Futures | 63.81 | +5.55 | +9.53% |
| Gold Futures | 1,294.20 | -21.60 | -1.64% |
| S&P 500 | 2,907.41 | +96.49 | +3.43% |
| S&P Energy | 499.60 | +14.64 | +3.02% |
| Hang Seng Composite Index | 4,021.29 | +156.60 | +4.05% |
| DJIA | 26,412.30 | +709.41 | +2.76% |
| Korean KOSPI Index | 2,233.45 | +85.04 | +3.96% |
| Nasdaq | 7,984.16 | +340.76 | +4.46% |
| S&P Basic Materials | 363.77 | +14.35 | +4.11% |
| Russell 2000 | 1,584.80 | +28.92 | +1.86% |
| S&P/TSX VENTURE COMP IDX | 625.64 | +1.42 | +0.23% |
| XAU | 75.78 | -1.64 | -2.12% |
| Index | Close | Quarterly Change($) |
Quarterly Change(%) |
|---|---|---|---|
| Natural Gas Futures | 2.65 | -0.32 | -10.68% |
| 10-Yr Treasury Bond | 2.56 | -0.18 | -6.64% |
| DJIA | 26,412.30 | +2,410.38 | +10.04% |
| Oil Futures | 63.81 | +11.22 | +21.33% |
| S&P 500 | 2,907.41 | +310.77 | +11.97% |
| Gold Futures | 1,294.20 | -6.30 | -0.48% |
| S&P Energy | 499.60 | +38.43 | +8.33% |
| Nasdaq | 7,984.16 | +998.10 | +14.29% |
| Korean KOSPI Index | 2,233.45 | +170.17 | +8.25% |
| S&P Basic Materials | 363.77 | +35.01 | +10.65% |
| Russell 2000 | 1,584.80 | +139.37 | +9.64% |
| Hang Seng Composite Index | 4,021.29 | +507.30 | +14.44% |
| S&P/TSX Global Gold Index | 193.45 | +15.03 | +8.42% |
| S&P/TSX VENTURE COMP IDX | 625.64 | +28.71 | +4.81% |
| XAU | 75.78 | +4.21 | +5.88% |
U.S. Global Investors, Inc. is an investment adviser registered with the Securities and Exchange Commission ("SEC"). This does not mean that we are sponsored, recommended, or approved by the SEC, or that our abilities or qualifications in any respect have been passed upon by the SEC or any officer of the SEC.
This commentary should not be considered a solicitation or offering of any investment product.
Certain materials in this commentary may contain dated information. The information provided was current at the time of publication.
Some links above may be directed to third-party websites. U.S. Global Investors does not endorse all information supplied by these websites and is not responsible for their content.
Holdings may change daily. Holdings are reported as of the most recent quarter-end. The following securities mentioned in the article were held by one or more accounts managed by U.S. Global Investors as of (03/31/2019):
Barrick Gold Corp.
Newmont Mining Corp.
Yamana Gold Inc.
B2Gold Corp.
Franco-Nevada Corp.
Wheaton precious Metals Corp.
Royal Gold Inc.
Agnico Eagle Mines Ltd
Anglo American Platinum Ltd
Energy Fuels Inc/Canada
OTP Bank Nyrt
Boeing Co/The
*The above-mentioned indices are not total returns. These returns reflect simple appreciation only and do not reflect dividend reinvestment.
The Dow Jones Industrial Average is a price-weighted average of 30 blue chip stocks that are generally leaders in their industry.
The S&P 500 Stock Index is a widely recognized capitalization-weighted index of 500 common stock prices in U.S. companies.
The Nasdaq Composite Index is a capitalization-weighted index of all Nasdaq National Market and SmallCap stocks.
The Russell 2000 Index® is a U.S. equity index measuring the performance of the 2,000 smallest companies in the Russell 3000®, a widely recognized small-cap index.
The Hang Seng Composite Index is a market capitalization-weighted index that comprises the top 200 companies listed on Stock Exchange of Hong Kong, based on average market cap for the 12 months.
The Taiwan Stock Exchange Index is a capitalization-weighted index of all listed common shares traded on the Taiwan Stock Exchange.
The Korea Stock Price Index is a capitalization-weighted index of all common shares and preferred shares on the Korean Stock Exchanges.
The Philadelphia Stock Exchange Gold and Silver Index (XAU) is a capitalization-weighted index that includes the leading companies involved in the mining of gold and silver.
The U.S. Trade Weighted Dollar Index provides a general indication of the international value of the U.S. dollar.
The S&P/TSX Canadian Gold Capped Sector Index is a modified capitalization-weighted index, whose equity weights are capped 25 percent and index constituents are derived from a subset stock pool of S&P/TSX Composite Index stocks.
The S&P 500 Energy Index is a capitalization-weighted index that tracks the companies in the energy sector as a subset of the S&P 500.
The S&P 500 Materials Index is a capitalization-weighted index that tracks the companies in the material sector as a subset of the S&P 500.
The S&P 500 Financials Index is a capitalization-weighted index. The index was developed with a base level of 10 for the 1941-43 base period.
The S&P 500 Industrials Index is a Materials Index is a capitalization-weighted index that tracks the companies in the industrial sector as a subset of the S&P 500.
The S&P 500 Consumer Discretionary Index is a capitalization-weighted index that tracks the companies in the consumer discretionary sector as a subset of the S&P 500.
The S&P 500 Information Technology Index is a capitalization-weighted index that tracks the companies in the information technology sector as a subset of the S&P 500.
The S&P 500 Consumer Staples Index is a Materials Index is a capitalization-weighted index that tracks the companies in the consumer staples sector as a subset of the S&P 500.
The S&P 500 Utilities Index is a capitalization-weighted index that tracks the companies in the utilities sector as a subset of the S&P 500.
The S&P 500 Healthcare Index is a capitalization-weighted index that tracks the companies in the healthcare sector as a subset of the S&P 500.
The S&P 500 Telecom Index is a Materials Index is a capitalization-weighted index that tracks the companies in the telecom sector as a subset of the S&P 500.
The NYSE Arca Gold Miners Index is a modified market capitalization weighted index comprised of publicly traded companies involved primarily in the mining for gold and silver.
The Consumer Price Index (CPI) is one of the most widely recognized price measures for tracking the price of a market basket of goods and services purchased by individuals. The weights of components are based on consumer spending patterns.
The Purchasing Manager’s Index is an indicator of the economic health of the manufacturing sector. The PMI index is based on five major indicators: new orders, inventory levels, production, supplier deliveries and the employment environment.
The S&P/TSX Venture Composite Index is a broad market indicator for the Canadian venture capital market. The index is market capitalization weighted and, at its inception, included 531 companies. A quarterly revision process is used to remove companies that comprise less than 0.05% of the weight of the index, and add companies whose weight, when included, will be greater than 0.05% of the index.
Gross domestic product (GDP) is the monetary value of all the finished goods and services produced within a country’s borders in a specific time period, though GDP is usually calculated on an annual basis. It includes all of private and public consumption, government outlays, investments and exports less imports that occur within a defined territory.
A real estate investment trust is a company that owns, and in most cases operates, income-producing real estate. REITs own many types of commercial real estate, ranging from office and apartment buildings to warehouses, hospitals, shopping centers, hotels and timberlands. Some REITs engage in financing real estate.
The Bloomberg Barclays Global Aggregate Bond Index is a flagship measure of global investment grade debt from twenty-four local currency markets
The MSCI ACWI captures large and mid-cap representation across 23 Developed Markets (DM) and 24 Emerging Markets (EM) countries. The Small Business Optimism Index is compiled from a survey that is conducted each month by the National Federation of Independent Business (NFIB) of its members.
The University of Michigan Confidence Index is a survey of consumer confidence conducted by the University of Michigan. The report, released on the tenth of each month, gives a snapshot of whether or not consumers are willing to spend money.
The Bangkok SET Index is a capitalization-weighted index of all the stocks traded on the Stock Exchange of Thailand.
The Jakarta Stock Price Index is a modified capitalization-weighted index of all stocks listed on the regular board of the Indonesia Stock Exchange.
The FTSE Bursa Malaysia Index Series is a broad range of real-time indices, which cover all eligible companies listed on the Bursa Malaysia Main and ACE Markets. The indices are designed to measure the performance of the major capital segments of the Malaysian market, dividing it into large, mid, small cap, fledgling and Shariah-compliant series, giving market participants a wide selection and the flexibility to measure, invest and create products in these distinct segments.
