


With Yields Sinking Everywhere, Gold Just Hit New All-Time Highs…
Date Posted: August 9, 2019
Read time: 49 min
"It is no longer absurd to think that the nominal yield on U.S. Treasury securities could go negative," Joachim Fels, PIMCO's global economic advisor, warned investors this week. "Whenever the world economy next goes into hibernation, U.S. Treasuries--which many investors view as the ultimate 'safe haven' apart from gold--may be no exception to the negative yield phenomenon."
By Frank Holmes
CEO and Chief Investment Officer
U.S. Global Investors
“It is no longer absurd to think that the nominal yield on U.S. Treasury securities could go negative,” Joachim Fels, PIMCO’s global economic advisor, warned investors this week. “Whenever the world economy next goes into hibernation, U.S. Treasuries—which many investors view as the ultimate ‘safe haven’ apart from gold—may be no exception to the negative yield phenomenon.”
Fels seems not to be the only investor with this idea, judging by the increased demand for gold.
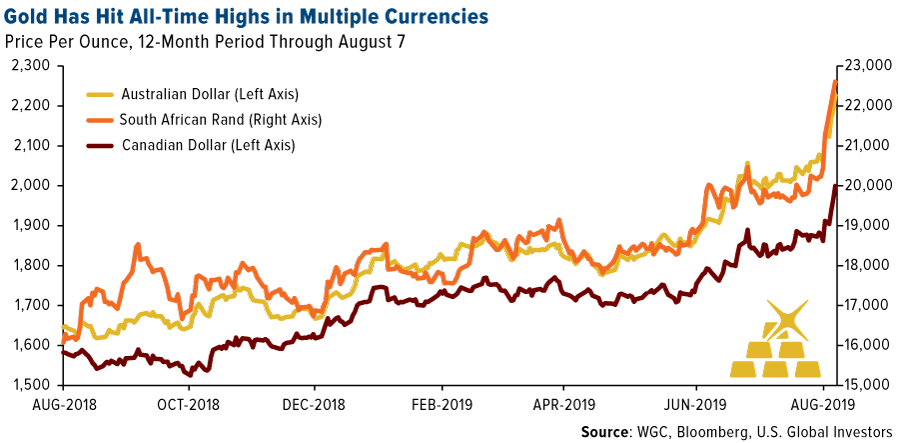
The price of the yellow metal headed for its best week in nearly two months as the total value of negative-yielding debt around the world touched a new record of $15 trillion. With the nominal yield on the 10-year Treasury having fallen below 2 percent—and just shy of 0 percent on an inflation-adjusted basis—gold surged above $1,500 an ounce in U.S. dollars (USD) for the first time since September 2013.
It also hit historic all-time highs when priced in a number of other world currencies, including the British pound, Russian ruble and Indian rupee. This week, the central bank of India, along with those in New Zealand and Thailand, surprised markets by cutting rates more than expected, adding to fears that an economic slowdown was imminent.
On Wednesday, gold’s performance for 2019 caught up with and surpassed that of the stock market.

Analysts at Goldman Sachs now say that $1,500 is only the beginning, and that we could see $1,600-an-ounce gold within the next six months.
“If growth worries persist, possibly due to a trade war escalation, gold could go even higher, driven by a larger ETF gold allocation from portfolio managers who still continue to under-own gold,” Goldman analyst Sabine Schels said in a note to investors this week. “Gold ETFs have recently built momentum almost as strong as in 2016, and we believe that can be maintained in the short-term.”
Indeed, gold ETFs attracted $2.6 billion of net global inflows in July alone, raising their collective holdings to 2,600 tonnes—a level unseen since March 2013, according to the World Gold Council (WGC).
A $1.2 Trillion Hit to the World Economy
For further insight on global trade, Goldman no longer believes a resolution to the U.S.-China trade war will occur before the 2020 presidential election. Today, in fact, President Donald Trump told reporters that “we are not ready to make a deal” with China, “but we’ll see what happens.”
Should the trade war continue to escalate, it could cost the world economy “dearly,” according to Bloomberg. New modeling by Bloomberg analysts shows that global GDP would be 0.6 percent lower by 2021, amounting to a whopping $1.2 trillion hit, if markets slumped as a result of a full blown trade war.
Currency Wars Are Pushing Up the Price of Gold
Again, it’s not just USD-priced gold that’s done well in recent days. The precious metal blew past new all-time highs in a number of currencies on top of those I already mentioned. They also included currencies in major gold-producing economies such as Australia, Canada and South Africa. Australia’s dollar traded at its lowest level against the USD since the financial crisis a decade ago.
One of our favorite ways to play this appreciation is with Russia gold stocks, particularly Moscow-based Polyus, which was up nearly 55 percent in the 12 months through August 8. Its peers, Polymetal (up 51 percent) and Highland Gold (75 percent), have also been winners in a strong gold-price environment.
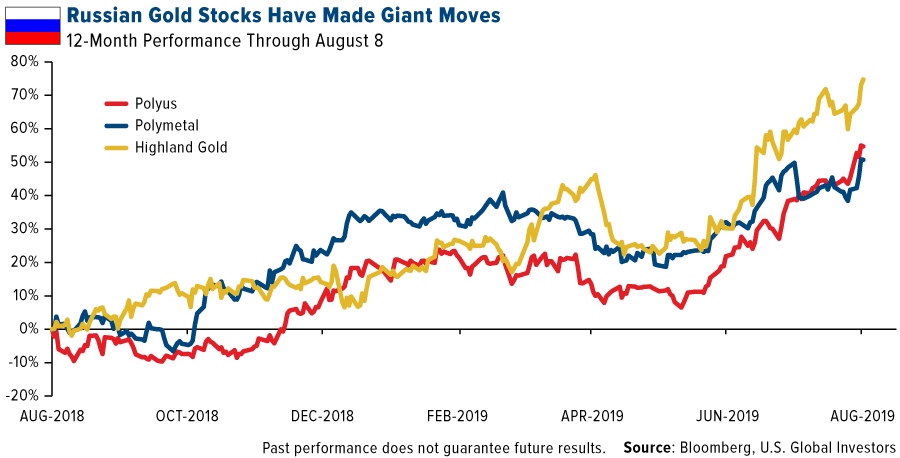
“Polyus is undoubtedly a growth company,” according to equity research firm Wood & Company. Analysts there note Polyus’ lower-than-average production cost of only $348 an ounce last year and attractive valuation of 6.8 times price-to-earnings (P/E). “It offers a decent yield more long-term growth than any other stock in Russian metals and mining, and we believe the sanction risks are small,” Wood analysts write. The producer’s dividend yield is expected to average between 5 percent and 6 percent this year, well above its peers.
Beijing Wants Even More Gold in Its Reserves
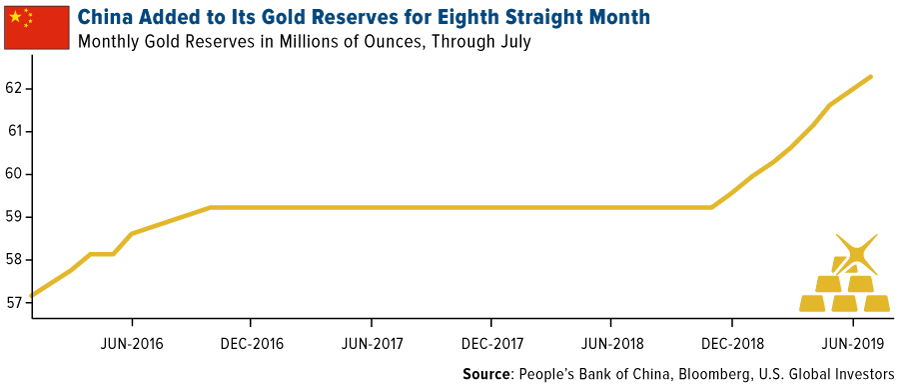
In other currency war news, China added to its official gold holdings for the eighth straight month in July. Its central bank increased holdings as much as 10 tons, after raising it 84 tons in June. Total holdings now stand at 62.26 million ounces, as the world’s second largest economy expands its efforts to diversify away from the USD.
As I explained earlier this week, China allowed its currency, the renminbi, to weaken past 7.0 versus the USD, a level not seen since 2008. This was just the latest development in the country’s trade spat with the U.S. that’s nearing its 18th month.
Doctor Copper Hits a Two-Year Low on Growth Concerns
Fears of slower growth may be beneficial for the price of gold right now, but they’re taking a toll on copper, often seen as a barometer for the global economy. The red metal is widely used in, well, anything that needs to conduct an electrical charge, and when a slowdown in industrial demand is expected, prices struggle.
Take a look below. Copper has more or less followed the global manufacturing purchasing manager’s index (PMI) down over the past year and a half. Factories across the globe contracted for the third straight month in July.
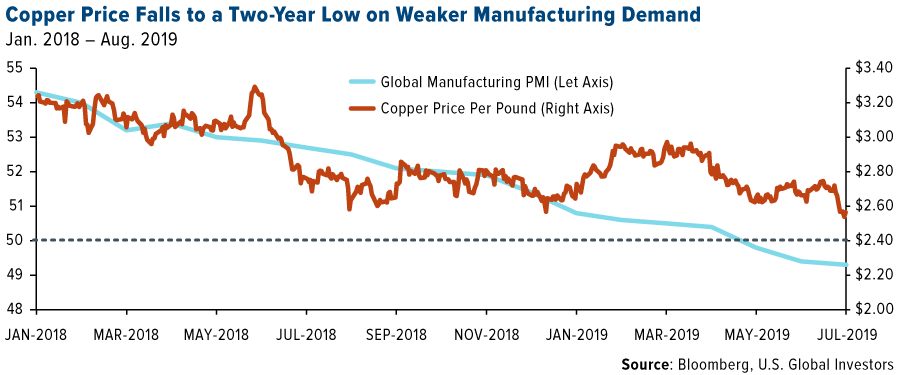
As the Wall Street Journal puts it, the slide “threatens to limit investment in new mines, a trend that industry analysts and executives say could lead in coming years to sizable shortages of the material critical to manufacturing and renewable-energy projects.”
The price of copper slid as low as $2.53 per pound on Monday, a 52-week low and nearly 25 percent down from its recent high of $3.30 from last June.
An economic gauge of heavy copper-using manufacturers indicated contraction in July. The Global Copper Users PMI fell from 50.0 in June to 48.6 last month, the weakest result in five months, according to IHS Markit.
“Companies noted that raised trade tensions played a part in reducing production, as new export orders fell at a sharper rate,” said IHS Markit economist David Owen, who added that weakness in the European auto sector also played a role in declining copper demand.
Want to learn more about the recent moves in metals and oil? Listen to my interview with Bloomberg’s Lisa Abramowicz and Paul Sweeney by clicking here!

Gold Market
This week spot gold closed at $1,492.30, up $51.70 per ounce, or 3.59 percent. Gold stocks, as measured by the NYSE Arca Gold Miners Index, ended the week higher by 6.23 percent. The S&P/TSX Venture Index came in off 2.92 percent. The U.S. Trade-Weighted Dollar fell 0.53 percent.
| Date | Event | Survey | Actual | Prior |
|---|---|---|---|---|
| Aug-8 | Initial Jobless Claims | 215k | 209k | 217k |
| Aug-9 | PPI Final Demand YoY | 1.7% | 1.7% | 1.7% |
| Aug-13 | Germany CPI YoY | 1.7% | — | 1.7% |
| Aug-13 | Germany ZEW Survey Current Situation | -5.9 | — | -1.1 |
| Aug-13 | Germany ZEW Survey Expectations | -28.0 | — | -24.5 |
| Aug-13 | CPY YoY | 1.7% | — | 1.6% |
| Aug-13 | China Retails Sales YoY | 8.6% | — | 9.8% |
| Aug-15 | Initial Jobless Claims | 212k | — | 209k |
| Aug-16 | Housing Starts | 1259k | — | 1253k |
Strengths
- The best performing metal this week was silver, up 4.78 percent. Silver had been somewhat detached from gold’s price changes, but now with recession odds rising, silver is catching its bid. Gold traders and analysts were bullish on their outlook for the yellow metal this week as it set a new six-year high above $1,500 per ounce. The metal saw a second straight weekly gain, fueled by uncertainty surrounding global trade tensions and monetary policy. Investors have taken notice of the rally with ETFs backed by gold growing holdings for nine straight days. Bloomberg reports that total gold held by ETFs rose 8.5 percent this year to 77.1 million ounces, the highest level in at least 12 months. SPDR Gold Shares, or the GLD, saw five straight days of inflows this week totaling a whopping $1 billion.

- Gold rose as much as 1.6 percent on Wednesday to above $1,500 per ounce, the highest since 2013. Wayne Gordon, executive director for commodities and foreign exchange at UBS Group, says “gold is serving its traditional role as a safe-haven asset” as the trade war tensions continue to heat up.
- Speaking of trade war, China continues to add more gold to its reserves. China’s central bank bought more gold in July, marking eight straight months of buying and a new total of 62.26 million ounces in holdings. Why might be China buying gold? Perhaps because it’s output for the first half of the year fell 5 percent year-over-year, to 180.68 tons, according to the China Gold Association. Russia also bought more gold in July. Its official reserve assets sat at $519.8 billion in July, up from $518.4 billion a month earlier.
Weaknesses
- The worst performing metal this week was palladium, but still closed up 1.14 percent as traders reduced their net-long futures position to a seven-week low. Turkey’s central bank gold holdings fell $248 million from the previous week—a sharp reversal after increasing by $164 million the week before that. Bloomberg reports that India’s gold imports in July fell to the lowest monthly inflow in more than three years as demand is hampered by higher prices in the domestic market. Remember: India is the world’s second largest consumer of the metal.
- In the week to August 7, equity funds worldwide saw outflows of $25 billion, which is the most redemptions since the start of the year, according to Bank of America strategists citing EPFR Global data. Fifteen billion dollars of that was in U.S. equity funds. On the upside, gold funds saw inflows of $2.3 billion in that same time period—the fourth biggest weekly inflow ever.
- Iamgold Corp. cut its attributable gold production forecast for the full year and reported second quarter production of 198,000 ounces, down 7.5 percent year-over-year. Iamgold’s share price tumbled over 14 percent on the disappointing news.
Opportunities
- Taking another look at the gold-to-silver ratio, let’s remember what happened in summer 2011. There were major fears of a recession, big concerns about Europe and a surge in the Swiss franc, which led to both gold and silver hitting post-crisis peaks. Since then, the ratio has been falling. Bloomberg’s Joe Weisenthal thinks the ratio could have room to run now if things continue as they are. Could silver see more upside than gold? Bloomberg’s Eddie van der Walt writes that silver has outperformed gold over the last month and appears to be reestablishing its positive beta, which could mean if gold rallies, silver will rise faster.
- What’s worrying some investors? China buying more gold and the falling copper-to-gold ratio. China stocking up on bullion, often seen as a safe haven asset, and diversifying away from the U.S. dollar could mean that the country is gearing up for a prolonged trade conflict and currency war. The copper-to-gold ratio is often used as a sentiment barometer for the global economy, and the ratio has now fallen back to levels last seen in November 2016, right before President Trump won the election. Both of these factors boost gold’s demand as a safe haven.
- Goldman Sachs continues to be a gold bull. Analysts predict that gold will climb even further to $1,600 per ounce by the end of this year as investors continue to seek haven assets, reports Bloomberg. Last week Bank of America Merrill Lynch analyst Michael Widmer said that gold could even climb toward $2,000 in the next two years due to dovish central banks and the growing amount of negative-yielding government bonds.
Threats
- Bloomberg’s Anchalee Worrachate writes that President Trump’s trade war with China is also turning into a currency war and that it would be hard for him to win both those battles. If the yuan weakens further, it might prompt the U.S. to intervene, which it hasn’t done since 2000. UBS strategists wrote in a note this week that “the more likely outcome of the explicit currency war would be further extension of uncertainty, which ironically could prove to be dollar-positive if risk assets fear weaker growth and volatility pushes higher.”
- AngloGold Ashanti’s CEO says that it’s been difficult to sell assets in the current market. CEO Kelvin Dushnisky says “it’s a more challenging market in terms of divestment, as opposed to years ago, because of speculation on potential assets coming into the market.” On Monday, around 5,000 protesters gathered outside a planned mine site owned by Dogu Biga Mining, the Turkish subsidiary of Alamos Gold Inc., to oppose the gold for environmental reasons.
- Concerns about the New York Fed keep growing, according to a piece by Bloomberg out this week. Just months ago two longtime officials departed suddenly, which shook staff, sank morale and then drew attention to leadership of the Fed under John Williams. Concerns are growing of his background, which lacks experience in the finance industry. The New York Fed is important as it serves as the central bank’s eyes and ears on Wall Street and is the only regional bank with a permanent vote on rate decisions.

Index Summary
- The major market indices finished down this week. The Dow Jones Industrial Average lost 0.75 percent. The S&P 500 Stock Index fell 0.46 percent, while the Nasdaq Composite fell 0.56 percent. The Russell 2000 small capitalization index lost 1.34 percent this week.
- The Hang Seng Composite lost 3.54 percent this week; while Taiwan was down 0.52 percent and the KOSPI fell 3.02 percent.
- The 10-year Treasury bond yield fell 1 basis point to 1.737 percent.
Domestic Equity Market
Strengths
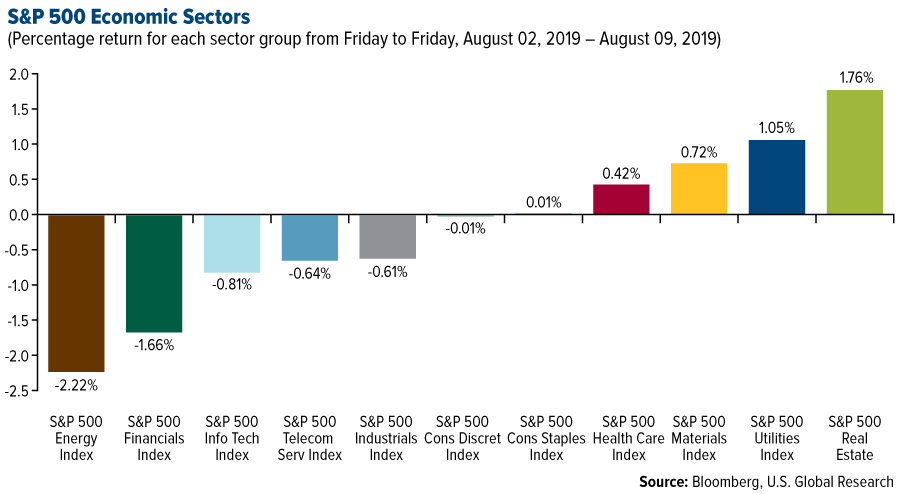
- Real estate was the best performing sector of the week, increasing 1.76 percent compared to an overall decrease of 0.08 percent for the S&P 500 Index.
- Advanced Micro Devices was the best performing stock for the week, increasing 16.13 percent.
- SoftBank surpassed profit forecasts ahead of its $100 billion fund launch. The company more than tripled net profits to a record $10.6 billion.
Weaknesses
- Energy was the worst performing sector for the week, decreasing 2.22 percent compared to an overall decrease of 0.08 percent for the S&P 500.
- Nektar Therapeutics was the worst performing stock for the week, falling -32.71 percent.
- Uber’s stock plunged after losing more money than expected. Shares tanked as much as 12 percent in aftermarket trading on the news, and were down about 7 percent in Friday premarket trading.
Opportunities
- Stocks offer more than bonds for income-oriented U.S. investors for the first time in Donald Trump’s presidency. This conclusion is based on a comparison between the dividend yield on the S&P 500 Index and the yield on 10-year Treasury notes. The gap turned positive Thursday after being negative since Nov. 10, 2016, two days after Trump was elected and two months before he took office, according to data compiled by Bloomberg.
- Smaller U.S. investors are so pessimistic about stocks that they may have set the stage for a market rebound, if history is any indication. Just 21.7 percent of the participants in a survey by the American Association of Individual Investors were bullish in the week ended Wednesday, and 48.2 percent were bearish. The gap favored the bears by more than 25 percentage points for just the 10th time since mid-2009. After the earlier instances, the S&P 500 Index had an average gain of 9.8 percent during the next three months.
- Bayer shares soared as much as 11 percent on Friday on a Bloomberg report that the German company has proposed to pay $8 billion to settle more than 18,000 U.S. lawsuits centered on its glyphosate-based weedkiller Roundup.
Threats
- Facebook is facing a class action lawsuit over its use of facial recognition technology that could cost it billions of dollars if it loses. A federal appeals court on Thursday rejected Facebook’s effort to undo a class action lawsuit claiming that it illegally collected and stored biometric data for millions of users without their consent.
- Adidas shares slip on disappointing sales figures. “Given the recent rerating in the shares since April and narrowing valuation gap versus peers, the lack of a sales or earnings beat is unusual and brand momentum remains concerning,” Credit Suisse analysts wrote of Adidas.
- Gaming stocks tanked after Trump linked “gruesome and grisly” video games to mass shootings. “We must stop the glorification of violence in our society,” Trump said Monday. “This includes the gruesome and grisly video games that are now commonplace.”
The Economy and Bond Market
Strengths
- The number of people who applied for unemployment benefits in early August fell back near post-2008 recession lows, signaling the labor market remains quite strong even though the economy has softened. Initial jobless claims dropped by 8,000 to a seasonally adjusted 209,000 in the seven days Aug. 3, the government said Thursday.
- The unemployment rate has been at 4 percent or less for 16 consecutive months, the longest such streak in 50 years.
- The University of Michigan’s consumer sentiment index, which peaked at 112 in 1999, has hovered above 90 for more than four years, something that hasn’t happened since the 1990s.
Weaknesses
- There’s limited hope for an imminent turnaround in the U.S. or the euro area, with the OECD’s Composite Leading Indicator for the two economies pointing toward a loss of momentum. The gauge, designed to anticipate turning points six to nine months before they happen, suggests slowing growth in Germany, while China shows stabilization. That’s in line with a Bloomberg Economics model indicating the weakest start of the year since the financial crisis.

- A gauge of U.S. service industries declined in July to an almost three-year low as orders continued to cool, indicating a sluggish start to the third quarter for the biggest part of the economy. The Institute for Supply Management’s non-manufacturing index fell to 53.7, the weakest since August 2016 and well below the median forecast of economists. The monthly drop follows the ISM’s report last week that showed a fourth straight month of slower growth in manufacturing.
- The UK economy shrank for the first time since 2012, as output fell 0.2% in July and August.
Opportunities
- Retail sales stats on Thursday will offer a clue on how the Fed will lean towards rate cutting in September.
- Investors will keep an eye on America’s latest consumer price index (CPI) inflation data on Tuesday.
- Bank of America strategists expect the bull market for municipal bonds to continue until May 2020 or later, they wrote in an August 9 research note.
Threats
- The gap between two- and 10-year Treasury yields is the flattest since 2007, the last time it was inverted, a sign of investors’ concern about the escalation of the U.S.-China trade war. The yield curve is reflecting the view that “the longer trade worsens, the greater the risk of material global growth slowdown,” said Mark Cabana, a strategist at Bank of America.
- Traders have boosted bets that the Federal Reserve will lower interest rates again after China escalated the trade war with the U.S. by weakening its currency. Money-market prices now imply expectations for more than 100 basis points of rate cuts by December 2020, compared with 75 basis points after the Fed reduced rates by a quarter of a point on July 31.
- Trade fears may have eased from recent highs but investors are still rushing to havens en masse, pushing the stockpile of negative-yielding bonds to a second record in a week. The market value of the Bloomberg Barclays Global Negative Yielding Debt Index closed at $15.6 trillion Wednesday, spurred by recession fears and dovish monetary bets. It’s an increase from the record notched Monday after Beijing’s retaliation against the fresh U.S. threat on tariffs.
Energy and Natural Resources Market
Strengths
- The best performing major commodity for the week was nickel, which gained 9.66 percent. Nickel is on a wild ride this week, surging 13 percent on Thursday, or almost $2,000 a ton. The massive price spike could be in response to Indonesia, the world’s top producer, considering tightening rules on raw materials exports. Investments in U.S.-listed commodity ETFs more than doubled last week, led by energy funds, for a fourth straight week of inflows.
- Even amid the trade war, China’s demand for commodities remains strong. Bloomberg reports that imports of soy, coal, crude oil and others gained last month. Soybean imports rose to an 11-month high, boosted by volumes from South America. The nation’s imports shrank by less than forecast and export growth rebounded.
- BloombergNEF reports that battery electric vehicle sales in Canada grew 30 percent in the first half of 2019 from the same period a year ago. Chevron Corp. has begun its long-delayed carbon capture project at the Gorgon gas export venture in an island off the coast of Australia. Once operational, Chevron expects to store up to 4 million tons of carbon dioxide annually by injecting it deep underground, which will reduce emissions at the development by around 40 percent, reports Bloomberg.
Weaknesses
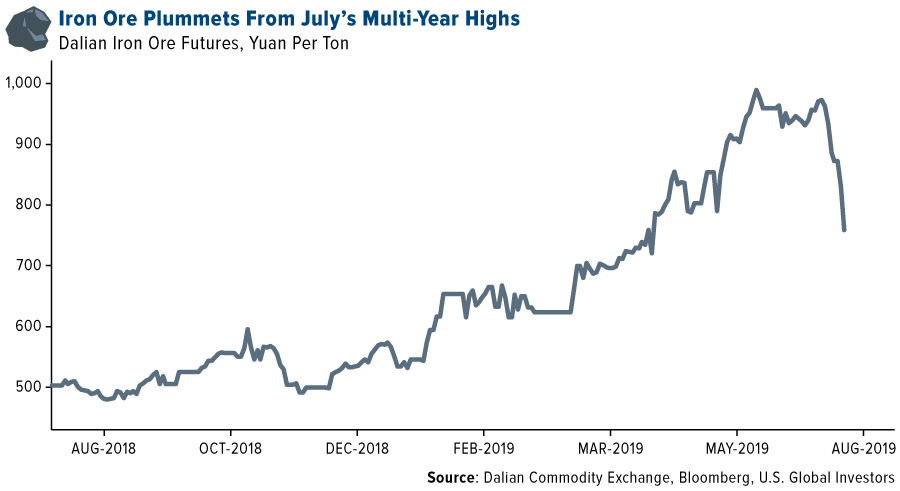
- The worst performing major commodity for the week was lumber, which fell 5.22 percent. China devalued its currency, the yuan, to below seven per dollar for the first time in a decade, sending many commodities sinking. The move sent jitters throughout global markets and saw copper plummet to a two-year low. Iron ore also suffered, falling back below $100 per ton in Singapore futures. The metal rallied through the first half of the year, hitting highs in July, then falling sharply as supplies pick up, profitability falls and investors more away from raw materials amid the trade war, reports Bloomberg.
- Oil crashed to a seven-month low after a surprise surge in American crude stockpiles. Futures fell 4.7 percent on Wednesday. Bloomberg reports that Brent crude futures have fallen more than 20 percent from late April to around $59 per barrel. Although Brent rose slightly in London on Friday morning, it was still down 6 percent for the week and headed for a second straight weekly loss as investors also weigh the ongoing U.S.-China trade tensions.
- According to BP Plc, American exports of natural gas are barely profitable due to a sharp reversal in the economics of shipping LNG overseas. Natural gas is also headed for its fourth straight weekly loss as record production continues to refill storage despite hot summer temperatures, reports Bloomberg. Futures fell as much as 2 percent Friday morning as domestic output jumped to a record earlier this week.
Opportunities
- Capital markets’ support for U.S. energy companies has faded, especially shale drillers. Swiss commodities giant Mercuria Energy Group sees that as an opportunity. CEO Marco Dunand said that the company is in talks on several ventures with shale producers. “If we can come in and find a way to measure the risk differently, because we may be able to transport some of that commodity, then we are prepared to allocate more time and resources to the industry.”
- BloombergNEF reports that the U.S. will become the world’s largest energy storage market in 2020 for the first time since 2013, after lagging behind South Korea and China in terms of installations since 2017. Demand is rapidly increasing for large energy storage installations and the U.S. is forecast to install almost 9 gigawatts worth in 2025 alone.
- In more renewable news, four Japanese companies have teamed up to build the world’s first zero-emission tanker by mid-2021 that will be powered by large-capacity batteries, reports Bloomberg. The shipping and maritime industry is under growing pressure to improve environmental performance.
Threats
- As the trade war continues to heat up, U.S. oil could suffer the biggest blows. If the new tariffs against China threatened for September 1 do take effect, China is expected to retaliate with more tariffs on U.S. imports, including oil. If China instead turns to Iranian oil, which is under sanctions from the U.S., prices per barrel could plummet to $30.
- The major oil companies are increasingly facing calls to become more environmentally friendly. Some are listening and making initiatives, but others aren’t. Bloomberg reports that earlier this year one of Meryam Omi’s deputies at Legal & General Investment Management met with board members and managers from ExxonMobil to goes over how the company can address climate change. Apparently Exxon listened, but did not accept the suggestions. Instead, Exxon persuaded the SEC to block the shareholder resolution calling for the company to address climate risks.
- The United Nations released a report this week saying that climate change is putting the world’s food supply at risk and that crop yields are already falling in some areas. As greenhouse emissions continue to rise, some crops are becoming less nutritious. According to the report, in a high-carbon atmosphere, wheat could become less nutritious by losing 6 percent to 13 percent of its protein and 4 percent to 7 percent of its zinc.

Emerging Europe
Strengths
- Romania was the best performing country this week, gaining 86 basis points. Romania has little exposure to the trade war effects, and with the U.S.-China trade war discussions intensifying this week, the eastern European nation was a good place to hide. Moreover, as investors are looking for higher yielding instruments, Romanian equites offer the highest dividends in Europe, even higher than Russian dividends, which are yielding on average 7.8 percent.
- The Hungarian forint was the best performing currency this week, gaining 1.7 percent against the U.S. dollar. The forint was supported by the country’s strong economy. Next week gross domestic product (GDP) data will be released and Bloomberg surveys estimate growth of 4.6 percent year-over-year.
- Materials was the best performing sector among eastern European markets this week.
Weaknesses
- Greece was the worst performing country this week, losing 5.1 percent. Banks sold off sharply, losing more than 10 percent in the past five days. The biggest losses occurred on Monday when Greek banks lost 7.4 percent in one day due to global worries on trade tensions.
- The Russian ruble was the worst performing currency in the region this week, losing 15 basis points against the U.S. dollar. The ruble was under pressure due to a weaker oil price and the U.S. imposing a second round of sanctions on Russia for the poisoning of Skripal’s family in London last year.
- Consumer discretionary was the worst performing sector among eastern European markets this week.
Opportunities
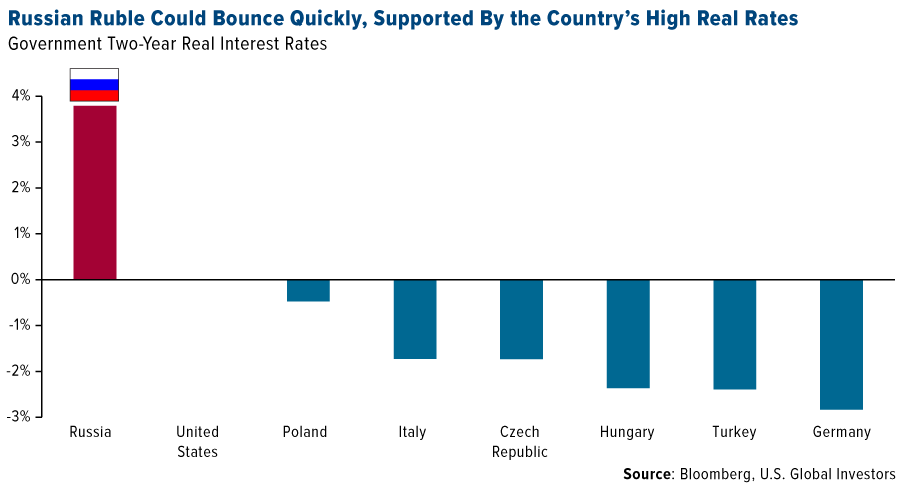
- As the chart below illustrates, most counties in central Europe offer investors negative real rates. Russia is the outlier, still offering positive rates. The Russian ruble could appreciate against the U.S. dollar, supported by investors looking for higher yielding instruments. This comes even despite the U.S. imposing a second round of sanctions on Russia.
- Turkish equites rebounded from a low at the end of May, and over the long term still has plenty of room to appreciate as the Istanbul exchange trades well below the MSCI emerging market index. Investors will watch central bank decisions and the lira for further signs of stability.
- OTP Bank, a Hungarian lender, reported strong quarterly results, and expects further profit increases supported by the country’s strong economy and expansions across southeastern Europe. OTP has been considering buys from Albania to Moldovia.
Threats
- Brent crude oil slid into bear-market territory this week, as the U.S.-China trade disagreement threatened to expand into a currency war and lower oil demand. Lower oil prices could present a headwind for Russia’s economy, as oil sales are the country’s main source of income.
- The European’s Union’s top court could rule against Polish banks later this month in a case regarding potentially abusive clauses in the bank’s foreign-currency mortgage agreements. The issue of how to deal with Poland’s $32 billion of non-zloty loans, mostly denominated in Swiss francs, may return to haunt Polish lenders. Bank Millennium, Getin Bank and mBank are holding the largest amounts of Swiss franc loans.
- Germany’s economy likely shrank in the second quarter as the country’s industrial slowdown hampered growth. Bloomberg economists predict that Germany’s GDP will drop by 40 basis points in the second quester. Many investors see Germany as a locomotive of Europe, and when the locomotive is losing speed, it slows down the whole train.
China Region
Strengths
- The best performing country in the region for the week was India, up 1.25 percent. Indian stocks advanced on optimism that the government may drop an increased tax on foreign investors registered as trusts, a step that had triggered a selloff by overseas investors.
- The best performing sector in Hong Kong’s Hang Seng Composite Index was telecommunications, down 45 basis points.
- Indonesia’s second quarter GDP reading clocked in at a 5.05 percent year-over-year pace, ever-so-slightly ahead of expectations and continuing to hold relatively steady.
Weaknesses
- The worst performing country in the region for the week was the Philippines, down 3.39 percent. The nation reported 5.5 percent GDP growth in the second quarter on Thursday, the slowest in four years.
- The worst performing sector in Hong Kong’s Hang Seng Composite Index this week was conglomerates, down 5.24 percent.
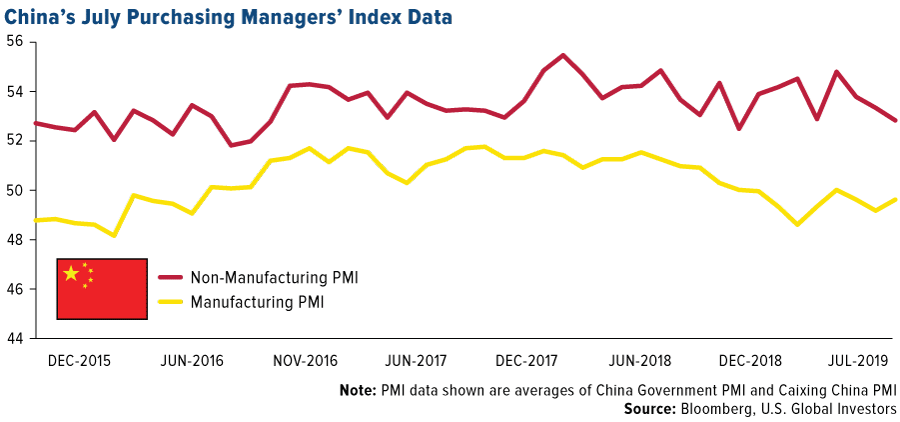
- The Caixin China Services PMI missed expectations this week, coming in at a still-expansionary 51.6, just shy of expectations for a 52.0 print and below the prior reading of 52.0. Recall also that late last week the official Manufacturing PMI, while contractionary, did beat expectations, firming at 49.7, up from 49.4 and ahead of an expected 49.6 print. The Caixin China Manufacturing PMI also beat late last week, clocking in at 49.9, ahead of expectations for a 49.5 reading and up from last month at 49.4.
Opportunities
- It remains possible that between now and the implementation of the new tariffs on China that the two sides could make more headway; talks are still currently scheduled for September, and top economic advisor Larry Kudlow has indicated that indeed, good things can still happen and there is a lot of time between now and September 1. The situation definitely regressed this week, but then again, one must ask: at what point in negotiations does one side take one step back in hopes of two steps forward? So long as talks remain ongoing, there remains a major opportunity for resolution and dramatic improvement in sentiment.
- U.S. Secretary of State Mike Pompeo indicated this week that the U.S. and North Korea “are planning for negotiations in a couple of weeks,” according to Bloomberg News report citing the AP.
- Global easing continues apace, as the central banks of New Zealand, India and Thailand all cut rates unexpectedly on Wednesday (see also: our Gold section…).
Threats
- If you track this piece weekly, you’ll know how long we’ve argued that the threat of a trade war must remain a threat until it isn’t, and, moreover, that the renminbi rising could also pose a problem. Well, welcome to this week, where the front page from Tuesday’s copy of The Wall Street Journal simply stated, and rather aptly summarized, “U.S., China Escalate Trade War.” Late last week you’ll recall President Trump announced impending implementation of new tariffs; over the weekend China let the yuan go into freefall through the big seven and the U.S. soon followed with a “Currency Manipulator” label. This does indeed make the situation more threatening overall. Bear in mind that if China weakens its currency, that weakness also affects other countries with which China does business, not only the United States.
- Once again, unrest continues in Hong Kong, as demonstrations and protests stretched through a ninth weekend (soon to be a tenth?) with Beijing issuing sterner warnings all the while.
- Pakistan “downgraded its diplomatic relations and suspended its bilateral trade agreement with India after New Delhi revoked seven decades of autonomy for the disputed Muslim-majority state of Kashmir,” Bloomberg reported this week as the spat between the two nations escalated.
Blockchain and Digital Currencies
Strengths
- Of the cryptocurrencies tracked by CoinMarketCap, the best performing for the week ended August 9 was MinexCoin, up 141.20 percent. As risk assets across Asia, Europe and North America tumbled on escalating trade-war tensions, bitcoin climbed above the $12,000 mark for the first time in four weeks, reports Bloomberg. The digital coin is reporting gains for the eighth consecutive day.

- Seychelles’ stock exchange has just listed a tokenized security for trading, reports CoinDesk, becoming the first in the world to do so. “The exchange, MERJ, is licensed by the Indian Ocean nation’s Financial Services Authority as a securities exchange, clearing agency and securities depository (CSD), and is launching the token to represent its own equity,” the article explains.
- A popular investment app for stocks, ETFs and cryptocurrencies known as Robinhood, has been given the “green light” to operate as a broker in the U.K., writes CoinDesk. On Wednesday, it was announced that the firm’s subsidiary Robinhood International received a broker’s license from the country’s financial watchdog, the Financial Conduct Authority (FCA).
Weaknesses
- Of the cryptocurrencies tracked by CoinMarketCap, the best performing for the week ended August 9 was Baer Chain, down 55.10 percent.
- According to a confidential U.N. report seen by Reuters, North Korea is funding its weapons of mass destruction with cryptocurrency and fiat currency stolen from banks and exchanges. The report says that North Korea has used “widespread and increasingly sophisticated” hacks to collect roughly $2 billion, which is laundered over the web, reports CoinDesk.
- As reported by CoinDesk, five individuals have been charged over a $1.8 million cold-call cryptocurrency investment fraud. Detectives from the Financial and Cyber Crime Group, State Crime Command, allege that over 100 investors were duped into handing over A$2.7 million, believing they were generating significant profit.
Opportunities
- This week the Chinese yuan fell to 11-year lows against the dollar and the S&P 500 tumbled 2.7 percent. Despite all of this, bitcoin climbed higher. So what has given the world’s biggest digital currency new life? As MarketWatch reports, it is now seen my some market obervers as “digital gold,” or a new safe haven asset.
- According to CoinDesk, Standard Chartered Bank has announced the successful completion of the first interational letter of credit (LC) transaction on the oil industry-focused blockchain platform Voltron. The bank said on Wednesday that it had conducted the pilot transaction for PTT Group, which involved shipment of an oil product from Thailand to Singapore.
- Commerzbank is developing blockchain payments for automated trucks, reads one CoinDesk headline. This machine-to-machine payments solutions could be used to allow automated trucks to pay for power charging without the need for a human to get out their wallet. An announcement from the pilot partners on Thursday explains how the system already works. “In test transactions, Commerzbank put euros on the blockchain system and sent it to Daimler Trucks for the settlement of the payment,” CoinDesk writes.
Threats
- The world’s largest cryptocurrency exchange by trading volume, Binance, is investigating the alleged leak of its customers’ verification information, reports CoinDesk. Up to 60,000 individual users could potentially be affected – users who sent KYC information to the company in 2018 and 2019.
- In a debate on CNBC this Tuesday, over bitcoin’s role as a “safe haven” asset, Shark Tank’s Kevin O’Leary played the role of skeptic, writes CoinDesk. O’Leary described the investment strategy as foolish in return, arguing his main point around alternative cryptocurrencies. He went on to explain that he purchased $100 of various digital currencies two years ago and his holdings are down about 70 percent.
- New Jersey’s Bureau of Securities has announced enforcement against two state-based initial coin offerings (ICOs), writes CoinDesk, alleging that both ICOs were offering fraudulent securities offerings. The emergency orders were issued against Zoptax and UNOcall by Canadian and American regulators under the North American Securities Administrators Association and executed by New Jersey officials. “Zoptax was seeking between $500,000 and $3.4 million for its Zoptax Coins while UNOcall was issuing tokens and investments in its staking protocol which offered daily interest returns between 0.18% – 0.88%,” CoinDesk explains.

Leaders and Laggards
| Index | Close | Weekly Change($) |
Weekly Change(%) |
|---|---|---|---|
| S&P/TSX Global Gold Index | 252.16 | +14.97 | +6.31% |
| Gold Futures | 1,509.50 | +52.00 | +3.57% |
| Natural Gas Futures | 2.12 | +0.00 | +0.05% |
| S&P/TSX VENTURE COMP IDX | 593.83 | -1.91 | -0.32% |
| 10-Yr Treasury Bond | 1.74 | -0.11 | -6.06% |
| Nasdaq | 7,959.14 | -44.93 | -0.56% |
| Oil Futures | 54.43 | -1.23 | -2.21% |
| Hang Seng Composite Index | 3,470.52 | -127.53 | -3.54% |
| S&P 500 | 2,918.65 | -13.40 | -0.46% |
| DJIA | 26,287.44 | -197.57 | -0.75% |
| Korean KOSPI Index | 1,937.75 | -60.38 | -3.02% |
| Russell 2000 | 1,513.04 | -20.62 | -1.34% |
| S&P Energy | 435.96 | -9.89 | -2.22% |
| S&P Basic Materials | 361.64 | +2.58 | +0.72% |
| XAU | 95.78 | +4.96 | +5.46% |
| Index | Close | Monthly Change($) |
Monthly Change(%) |
|---|---|---|---|
| Natural Gas Futures | 2.12 | -0.32 | -13.18% |
| S&P/TSX Global Gold Index | 252.16 | +25.66 | +11.33% |
| 10-Yr Treasury Bond | 1.74 | -0.33 | -15.86% |
| Oil Futures | 54.43 | -6.00 | -9.93% |
| Gold Futures | 1,509.50 | +84.60 | +5.94% |
| S&P 500 | 2,918.65 | -74.42 | -2.49% |
| S&P Energy | 435.96 | -38.30 | -8.08% |
| Hang Seng Composite Index | 3,470.52 | -293.35 | -7.79% |
| DJIA | 26,287.44 | -572.76 | -2.13% |
| Korean KOSPI Index | 1,937.75 | -121.03 | -5.88% |
| Nasdaq | 7,959.14 | -243.39 | -2.97% |
| S&P Basic Materials | 361.64 | +0.86 | +0.24% |
| Russell 2000 | 1,513.04 | -52.00 | -3.32% |
| S&P/TSX VENTURE COMP IDX | 593.83 | +7.98 | +1.36% |
| XAU | 95.78 | +9.92 | +11.55% |
| Index | Close | Quarterly Change($) |
Quarterly Change(%) |
|---|---|---|---|
| Natural Gas Futures | 2.12 | -0.47 | -18.23% |
| 10-Yr Treasury Bond | 1.74 | -0.71 | -29.01% |
| DJIA | 26,287.44 | +459.08 | +1.78% |
| Oil Futures | 54.43 | -7.27 | -11.78% |
| S&P 500 | 2,918.65 | +47.93 | +1.67% |
| Gold Futures | 1,509.50 | +206.30 | +15.83% |
| S&P Energy | 435.96 | -35.31 | -7.49% |
| Nasdaq | 7,959.14 | +48.55 | +0.61% |
| Korean KOSPI Index | 1,937.75 | -164.26 | -7.81% |
| S&P Basic Materials | 361.64 | +21.23 | +6.24% |
| Russell 2000 | 1,513.04 | -57.01 | -3.63% |
| Hang Seng Composite Index | 3,470.52 | -299.54 | -7.95% |
| S&P/TSX Global Gold Index | 252.16 | +72.78 | +40.57% |
| S&P/TSX VENTURE COMP IDX | 593.83 | +1.72 | +0.29% |
| XAU | 95.78 | +27.79 | +40.87% |
U.S. Global Investors, Inc. is an investment adviser registered with the Securities and Exchange Commission ("SEC"). This does not mean that we are sponsored, recommended, or approved by the SEC, or that our abilities or qualifications in any respect have been passed upon by the SEC or any officer of the SEC.
This commentary should not be considered a solicitation or offering of any investment product.
Certain materials in this commentary may contain dated information. The information provided was current at the time of publication.
Some links above may be directed to third-party websites. U.S. Global Investors does not endorse all information supplied by these websites and is not responsible for their content.
Holdings may change daily. Holdings are reported as of the most recent quarter-end. The following securities mentioned in the article were held by one or more accounts managed by U.S. Global Investors as of (06/30/2019):
Chevron Corp.
OTP Bank Nyrt
Polymetal International PLC
Polyus PJSC
Highland Gold Mining Ltd
SPDR Gold Shares
Iamgold Corp
AngloGold Ashanti Ltd
Alamos Gold Inc
*The above-mentioned indices are not total returns. These returns reflect simple appreciation only and do not reflect dividend reinvestment.
The Dow Jones Industrial Average is a price-weighted average of 30 blue chip stocks that are generally leaders in their industry.
The S&P 500 Stock Index is a widely recognized capitalization-weighted index of 500 common stock prices in U.S. companies.
The Nasdaq Composite Index is a capitalization-weighted index of all Nasdaq National Market and SmallCap stocks.
The Russell 2000 Index® is a U.S. equity index measuring the performance of the 2,000 smallest companies in the Russell 3000®, a widely recognized small-cap index.
The Hang Seng Composite Index is a market capitalization-weighted index that comprises the top 200 companies listed on Stock Exchange of Hong Kong, based on average market cap for the 12 months.
The Taiwan Stock Exchange Index is a capitalization-weighted index of all listed common shares traded on the Taiwan Stock Exchange.
The Korea Stock Price Index is a capitalization-weighted index of all common shares and preferred shares on the Korean Stock Exchanges.
The Philadelphia Stock Exchange Gold and Silver Index (XAU) is a capitalization-weighted index that includes the leading companies involved in the mining of gold and silver.
The U.S. Trade Weighted Dollar Index provides a general indication of the international value of the U.S. dollar.
The S&P/TSX Canadian Gold Capped Sector Index is a modified capitalization-weighted index, whose equity weights are capped 25 percent and index constituents are derived from a subset stock pool of S&P/TSX Composite Index stocks.
The S&P 500 Energy Index is a capitalization-weighted index that tracks the companies in the energy sector as a subset of the S&P 500.
The S&P 500 Materials Index is a capitalization-weighted index that tracks the companies in the material sector as a subset of the S&P 500.
The S&P 500 Financials Index is a capitalization-weighted index. The index was developed with a base level of 10 for the 1941-43 base period.
The S&P 500 Industrials Index is a Materials Index is a capitalization-weighted index that tracks the companies in the industrial sector as a subset of the S&P 500.
The S&P 500 Consumer Discretionary Index is a capitalization-weighted index that tracks the companies in the consumer discretionary sector as a subset of the S&P 500.
The S&P 500 Information Technology Index is a capitalization-weighted index that tracks the companies in the information technology sector as a subset of the S&P 500.
The S&P 500 Consumer Staples Index is a Materials Index is a capitalization-weighted index that tracks the companies in the consumer staples sector as a subset of the S&P 500.
The S&P 500 Utilities Index is a capitalization-weighted index that tracks the companies in the utilities sector as a subset of the S&P 500.
The S&P 500 Healthcare Index is a capitalization-weighted index that tracks the companies in the healthcare sector as a subset of the S&P 500.
The S&P 500 Telecom Index is a Materials Index is a capitalization-weighted index that tracks the companies in the telecom sector as a subset of the S&P 500.
The NYSE Arca Gold Miners Index is a modified market capitalization weighted index comprised of publicly traded companies involved primarily in the mining for gold and silver.
The Consumer Price Index (CPI) is one of the most widely recognized price measures for tracking the price of a market basket of goods and services purchased by individuals. The weights of components are based on consumer spending patterns.
The Purchasing Manager’s Index is an indicator of the economic health of the manufacturing sector. The PMI index is based on five major indicators: new orders, inventory levels, production, supplier deliveries and the employment environment.
The S&P/TSX Venture Composite Index is a broad market indicator for the Canadian venture capital market. The index is market capitalization weighted and, at its inception, included 531 companies. A quarterly revision process is used to remove companies that comprise less than 0.05% of the weight of the index, and add companies whose weight, when included, will be greater than 0.05% of the index.
Gross domestic product (GDP) is the monetary value of all the finished goods and services produced within a country’s borders in a specific time period, though GDP is usually calculated on an annual basis. It includes all of private and public consumption, government outlays, investments and exports less imports that occur within a defined territory.
The MSCI Emerging Markets Index measures mid- and large-cap equity performance in 26 developing economies. The dividend yield or dividend-price ratio of a share is the dividend per share, divided by the price per share. It is also a company’s total annual dividend payments divided by its market capitalization, assuming the number of shares is constant. It is often expressed as a percentage. There is no guarantee that the issuers of any securities will declare dividends in the future or that, if declared, will remain at current levels or increase over time. The Global Copper Users Purchasing Managers Index (PMI) is a composite indicator designed to give an accurate overview of operating conditions at manufacturers identified as heavy users of copper. The price-to-earnings ratio (P/E ratio) is the ratio for valuing a company that measures its current share price relative to its per-share earnings (EPS). The composite leading indicator (CLI) is designed to provide early signals of turning points in business cycles showing fluctuation of the economic activity around its long term potential level. CLIs show short-term economic movements in qualitative rather than quantitative terms. A basis point is one hundredth of one percent, used chiefly in expressing differences of interest rates. Beta is a measure of a stock’s volatility in relation to the market. By definition, the market has a beta of 1.0, and individual stocks are ranked according to how much they deviate from the market.

