


Frank Talk
Gold Finds Support as Key Inflation Rate Hits a 30-Year High
Date Posted: October 4, 2021
Read time: 9 min
Contrary to popular belief, what’s good for the goose is not always good for the gander.
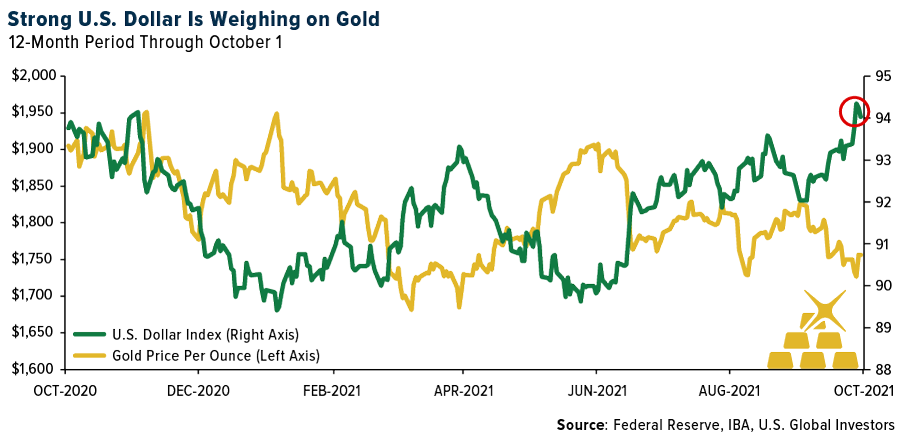
Last week the U.S. dollar advanced against a basket of foreign currencies to hit its highest level in about a year. For consumers and importers, this is good news, as it means the greenback offers greater purchasing power.
For exporters, on the other, and for the price of gold and other commodities that are priced in U.S. dollars, this is a headwind. In the chart below, you can see that gold and the dollar share an inverse relationship. When the dollar strengthens, the yellow metal falls; when it weakens, gold soars. It’s important for investors to recognize this relationship because it can help them manage their expectations.
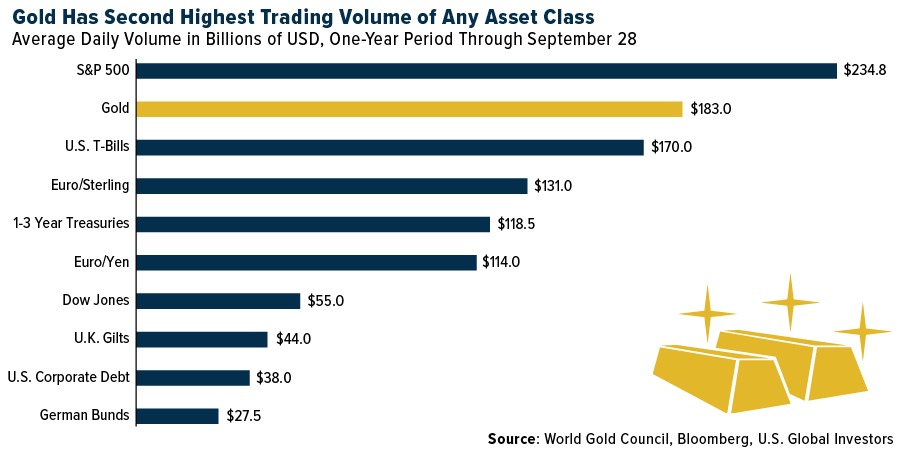
It’s also important for investors to keep in mind that gold continues to be one of the most heavily traded assets on the planet, in case they were wondering if Bitcoin is stealing some of its thunder as a store of value.
I often tell people that gold is the fourth most liquid asset, but the most recent data from the World Gold Council (WGC) shows that it’s actually the second most liquid asset following S&P 500 stocks. The precious metal’s average daily trading volume for the one-year period through September 28 was $183 billion, compared to the S&P 500 with nearly $235 billion in average daily volume. That dollar amount is enough to beat currency swaps as well as all government and corporate debt. The WGC measures gold’s liquidity by looking at data provided by global commodity exchanges, over-the-counter (OTC) markets and gold-backed ETFs.
Inflation Surging at Fastest Pace Since 1991. Will Gold Benefit?
Gold traded slightly up last Friday following the release of economic data showing that consumer prices jumped the most in 30 years. The personal consumption expenditure (PCE) index, which reflects changes in the prices of goods and services purchased by U.S. consumers, rose 4.3% year-over-year in August, the ninth straight month of accelerating inflation.
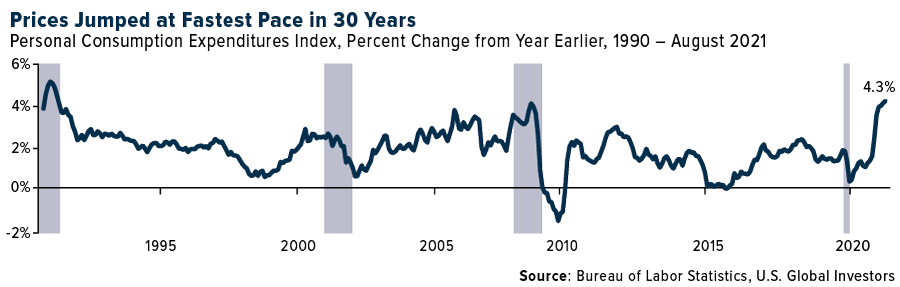
The PCE, by the way, is the Federal Reserve’s preferred measure of inflation. Fed Chair Jerome Powell, who earlier this year predicted inflation would be “transitory,” admitted last week during a Senate hearing that the bottlenecks and supply shortages that have contributed to higher prices were “frustrating,” and that we should see more of the same pressures into next year.
It’s not just the price of consumer goods that are soaring right now. Home prices, as measured by the S&P CoreLogic Case-Shiller National Home Price Index, rose 19.7% in the year ended July 2021, the highest annual rate since the index began in 1987. Apartment rents around the U.S. are also heating up. According to Zillow, the average listed rent in August was up 11.5% compared to last year, which some cities in Florida, Georgia and Washington seeing increases of more than 25%.
Oil at Multiyear Highs Despite the Stronger Dollar
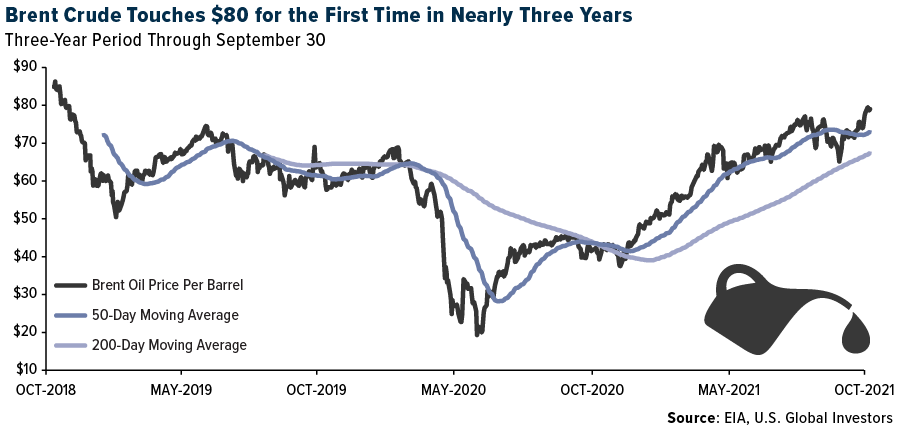
Because it’s priced in U.S. dollars, oil ordinarily tumbles when the greenback strengthens, but that wasn’t the case last week. Brent crude, the international benchmark, briefly topped $80 a barrel last Tuesday for the first time in nearly three years due to ongoing supply disruptions. As you can see below, Brent was trading well above both its 50-day and 200-day moving averages, which is a bullish sign.
What this means is that U.S. exporters are faced with the double-whammy of a stronger dollar and higher fuel costs.
The largest publicly traded exporting company in the U.S. is International Paper. The Memphis-based company, which manufactures paper and packaging goods, shipped close to 220,000 twenty-foot equivalent units (TEUs) in 2020, according to the Journal of Commerce (JOC). That’s second only to the privately held Koch Industries, which was responsible for exporting more than 280,000 TEUs last year. Koch is a massive conglomerate that, like International Paper, focuses a large part of its business on paper and pulp products.
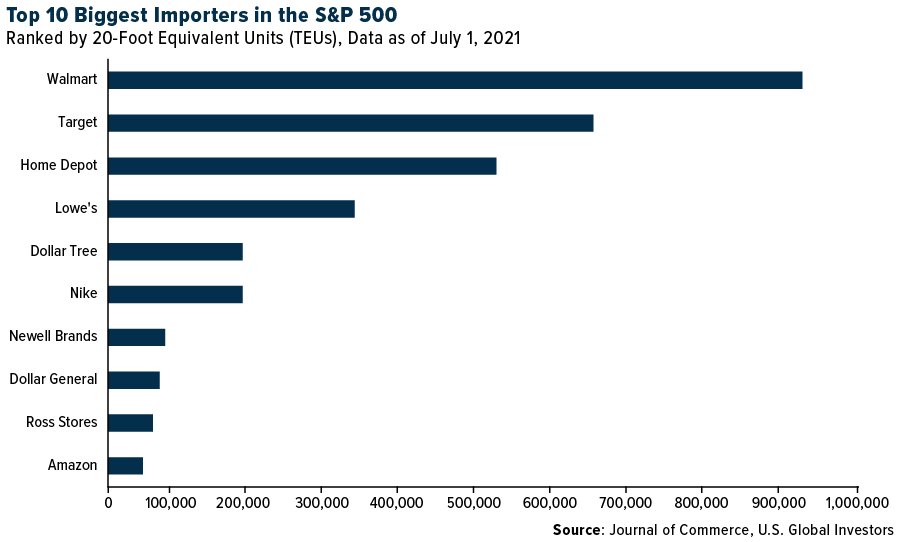
Again, a strong greenback is a tailwind for companies that do a lot of importing. Below are the S&P 500 companies that do the most importing, with Walmart topping the list at a jaw-dropping 930,000 TEUs.
For Airlines, Higher Fuel Costs Are Just More Fud (Fear, Uncertainty and Doubt)
Like a lot of analysts, I see the recent surge in oil prices as a short-term headwind, and already there’s been some contraction due to the stronger dollar and bigger-than-expected inventory build.
As such, this could be an attractive buying opportunity for airline stocks as the share of people fully vaccinated against Covid in high-income countries continues to increase.
I’ll be blunt: When it comes to airlines, the oil price increase is just more FUD (fear, uncertainty and doubt). It’s true that fuel is one of the airline industry’s biggest fixed costs, but what’s important for investors to understand is that higher oil prices have historically helped carriers demonstrate a certain level of capacity growth restraint. Unprofitable routes have been cancelled, for instance, which has contributed to higher load factors.
Plus, I would recommend investors pay more attention to airlines’ ancillary revenues, which play an increasingly important role in driving sales and cash flow. More and more, these revenues help offset higher fuel costs, something that was not necessarily the case 10 years ago when oil was above $100. In 2020, ancillary fees fell in absolute terms, but they represented a bigger piece of airlines’ total revenue.

Right now, vaccination rates and government policy are in the pilot’s cabin, so that’s what investors should be focused on instead.
Before the delta variant, leisure air travel had already returned to 2019 levels. Now that vaccination rates look good in most high-income countries and international travel restrictions are being lifted, I expect to see business travel make some progress.
Speaking for myself, I was recently able to attend the Gold Forum Americas conference in Denver, and I’ll be in Dubai later this month at the AIM Summit. Obviously more progress needs to be made before we’re back to normal pre-pandemic life, so I think this is a very attractive time to start participating with airlines.
Speaking of the AIM Summit… If you’ll be in the Dubai area on October 12, make sure to catch my panel on mining Bitcoin with sustainable energy. Apply to attend by clicking here!
Poll Below
All opinions expressed and data provided are subject to change without notice. Some of these opinions may not be appropriate to every investor. By clicking the link(s) above, you will be directed to a third-party website(s). U.S. Global Investors does not endorse all information supplied by this/these website(s) and is not responsible for its/their content.
The U.S. Dollar Index is an index of the value of the United States dollar relative to a basket of foreign currencies, often referred to as a basket of U.S. trade partners’ currencies. The S&P 500 Stock Index is a widely recognized capitalization-weighted index of 500 common stock prices in U.S. companies. The Dow Jones Industrial Average is a price-weighted average of 30 blue chip stocks that are generally leaders in their industry. The PCE price index, released each month in the Personal Income and Outlays report, reflects changes in the prices of goods and services purchased by consumers in the United States. Quarterly and annual data are included in the GDP release. The S&P CoreLogic Case-Shiller Home Price Indices are the leading measures of U.S. residential real estate prices, tracking changes in the value of residential real estate nationally. The Pending Home Sales Index (PHS), a leading indicator of housing activity, measures housing contract activity, and is based on signed real estate contracts for existing single-family homes, condos, and co-ops.
Holdings may change daily. Holdings are reported as of the most recent quarter-end. The following securities mentioned in the article were held by one or more accounts managed by U.S. Global Investors as of (09/30/2021): United Airlines Holdings Inc., Delta Air Lines Inc., Southwest Airlines Co., Wizz Air Holdings Inc., Spirit Airlines Inc., Allegiant Travel Co., Ryanair Holdings PLC, Azul SA, easyJet PLC, Hawaiian Holdings Inc., Alaska Air Group Inc., American Airlines Group Inc., The Home Depot Inc., Nike Inc., Amazon.com Inc.