


Investor Alert
Travel and Tourism Boom to Outperform 2019 Levels this Year
Date Posted: February 11, 2022
Read time: 34 min
Travel and tourism in the U.S. will outpace pre-pandemic levels this year, with the sector projected to generate $2 trillion, or 6% more than it did in 2019. That’s according to new economic modeling by the World Travel & Tourism Council (WTTC), working with Oxford Economics.
Travel and tourism in the U.S. will outpace pre-pandemic levels this year, with the sector projected to generate $2 trillion, or 6% more than it did in 2019. That’s according to new economic modeling by the World Travel & Tourism Council (WTTC), working with Oxford Economics.
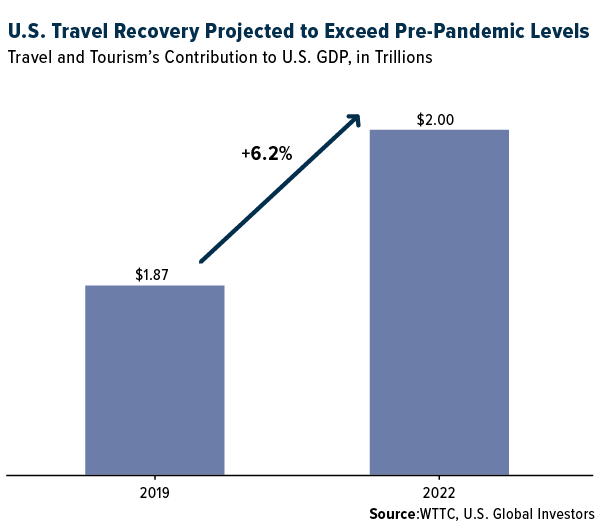
The London-based group—whose members include executives from over 200 companies including United Airlines, Japan Airlines, Expedia, Hilton, Royal Caribbean and others—said in a press release dated February 9 that this year’s recovery is dependent on two conditions: 1) steady vaccine rollout, and 2) the lifting of international travel restrictions.
If everything goes according to plan, travel and tourism could contribute $2 trillion to the U.S. economy in 2022, compared to $1.87 trillion in the year before the start of the pandemic.
On a global level, the industry is forecast to contribute $8.6 trillion in economic activity this year, according to the WTTC, which would be only 6.4% below the $9.2 trillion generated in 2019.
Bullish on a Full Recovery
I’m confident these expectations can be met and even exceeded, and I’m not alone.
Airline business confidence is improving, according to a January survey conducted by the International Air Transport Association (IATA), with nearly every airline CFO (96%) reporting that passenger demand increased in the fourth quarter of 2021. Another recent survey found that almost three quarters (73%) of business travelers believed an increase in corporate travel would be very or extremely likely this year.
The market also appears to see an end to the most restrictive travel mandates and border closures sooner rather than later.
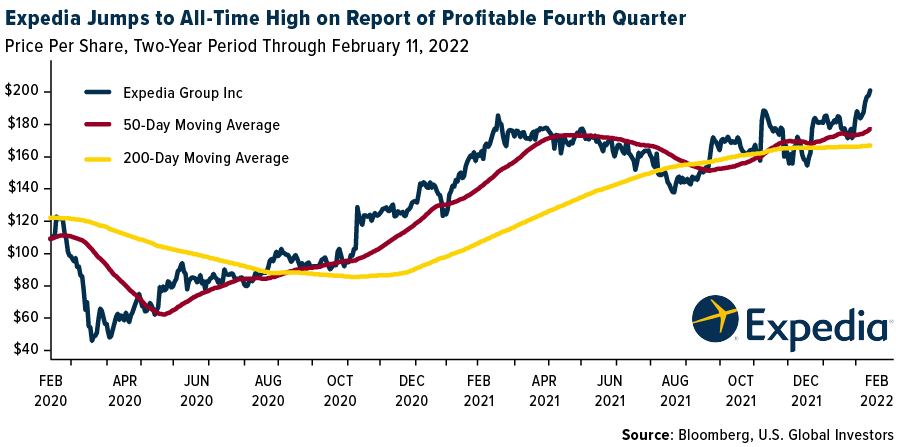
Shares of Expedia Group jumped to an all-time high this week after the company reported fourth-quarter net income of $276 million, or $1.70 per share, compared to a loss in the same quarter a year earlier. Expedia, which owns Orbitz, Travelocity, Hotels.com and more, saw gross bookings of $17.5 billion during the period, a remarkable increase of 131% from the fourth quarter of 2020.
Expedia CEO Peter Kern pointed out that, though the travel industry was disrupted by the emergence of Omicron, the impact wasn’t as severe as past waves. “Notably, the travel industry and traveling public prove more resilient with each passing wave, and we continue to expect a solid overall recovery in 2022,” Kern says.
We like and invest in Expedia as well as its U.S. peers Tripadvisor and Booking Holdings (owner of Priceline.com, Kayak.com, OpenTable and others). We also like China’s Trip.com Group and Japan’s AirTrip Corp. for the international exposure.
Travel Restrictions Had Little Effect on Omicron Spread
Online travel firms and commercial airlines are set to reap the benefits of governments lifting travel restrictions, especially following new research showing that the European Union’s (EU) efforts had little impact on controlling new infections.
A December-January study of Italy and Finland’s pre-departure testing measures found that they were completely “ineffective at preventing the spread of Omicron.” Because the testing was mandated six to eight weeks after Omicron first emerged, the variant was likely already seeded in those countries, making new travel restrictions purposeless. The study, conducted by Edge Health and Oxera, goes on to say that even if testing requirements had been in place earlier in the Omicron wave, “they would not have had any meaningful impact on the spread of Omicron in Finland, and would have had a small impact on the spread of Omicron in Italy.”
In light of this research, the IATA is urging the U.S. to end pre-departure testing for fully vaccinated passengers. “There is no use in closing the barn door after the horse has bolted,” says IATA Director General Willie Walsh.
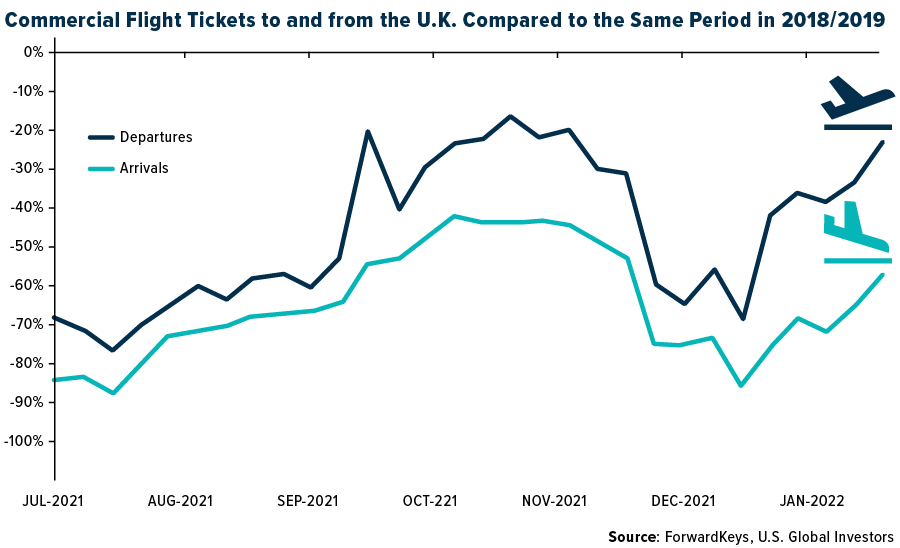
Such a move would not only make for a more pleasant flying experience but could also boost demand. After the United Kingdom government announced in late January that it would end Covid-19 testing for inbound vaccinated passengers, flight bookings soared, according to travel trends research firm ForwardKeys. The day following the announcement, in fact, combined inbound and outbound bookings surged to 84% of pre-pandemic levels.
Australia to Welcome Vaccinated Travelers
In the meantime, I’m pleased to see that Australia will be opening its borders for the first time since the pandemic began in March 2020. Beginning February 21, the country is scheduled to welcome international travelers who have been vaccinated against Covid.
Qantas Airways, Australia’s flagship carrier, has reportedly seen a “significant” increase in bookings by travelers eager to visit the country after nearly two years. Bookings are strongest out of the U.S. and United Kingdom, with spiked from South Africa, India and Canada, according to Qantas Domestic CEO Andrew David. To meet demand, the airline—which can trace its founding back to 1920—will bring back six overseas routes, including Sydney-Dallas, Sydney-Manila and Brisbane-Singapore.
This week, shares of Qantas traded close to AUD$5.60 in Sydney trading, the stock’s highest level since November 18. With revenues set to jump on an influx of new travelers, the stock could be well on its way to $6.00 and above, a price last seen in February 2020.
Interested in how you could participate? Shoot me an email at info@usfunds.com!
Index Summary
- The major market indices finished mostly down this week. The Dow Jones Industrial Average lost 1.00%. The S&P 500 Stock Index fell 1.82%, while the Nasdaq Composite fell 2.18%. The Russell 2000 small capitalization index gained 1.39% this week.
- The Hang Seng Composite gained 1.67% this week; while Taiwan was up 0.51% and the KOSPI fell 7.72%.
- The 10-year Treasury bond yield rose slightly to 1.916%.
Emerging Markets
Strengths
- The best performing country in emerging Europe for the week was Turkey, gaining 5.5%. The best performing country in Asia this week was Malaysia, gaining 3.5%.
- The Turkish lira was the best performing currency in emerging Europe this week, gaining 0.46%. The Thailand baht was the best performing currency in Asia this week, gaining 1.0%.
- China’s January lending and money supply data came in stronger than Broad M2 money supply growth accelerated to 9.8% from 9.0%, better than the 9.2% consensus.
Weaknesses
- The worst performing country in emerging Europe for the week was Romania, losing 0.09%. The worst performing country in Asia this week was the Philippines, losing 2.48%.
- The Russian ruble was the worst performing currency in emerging Europe this week, losing 1.03%. The Indian rupee was the worst performing currency in Asia this week, losing 0.95%.
- Hong Kong released weaker Manufacturing PMI data this week. Hong Kong’s PMI fell to 48.9 in January following the Caixin PMI reading. China’s Caixin Manufacturing PMI was released at the end of January at 49.1, below the 50 level that separates growth from contraction.

Opportunities
- European leaders have been working on de-escalation of the Ukraine-Russia conflict and there appear to be initial signs of progress being made. French President Emmanuel Macron met with the President of Russia, Vladimir Putin, in Moscow early in this week. Following that meeting, Macron then traveled to Ukraine for a meeting with President Zelensky.
- Russian equites are bouncing back after reaching a recent low at the end of January and falling 25% from last year’s mid-October peak. The U.S. is discussing additional sanctions on Russia; however, Europe does not desire to impose strict new sanctions. Russia is an important trading partner with the European Union. In fact, the trade between Russia and the EU stands at $250 billion, according to Wood & Company. Russia is supplying one-third of the EU’s natural gas and one-fourth of its oil.
- Malaysia’s economy returned to expansion territory at the end of 2021, with GDP in the final quarter rising 3.6% year-over-year, beating consensus. This pushed full-year GDP up 3.1%, within the official forecast range of 3%-4%. More Southeast Asian countries, heavily dependent on revenue from tourism, should soon start to recover with a bounce in travel.
Threats
- Medical experts in Hong Kong warned that the city could see 28,000 COVID-19 cases per day by March 1, versus slightly above 1,000 being reported now. If that happens, the entire city will have to be on a lockdown for two to three months in order to return to zero-covid.
- China bought 63% of the extra goods that it promised to buy in the trade deal with the United States. This was a two-year commitment that ended in December 2021. Most of the shortfalls came in energy, where China bought one-third of what it pledged to buy. The United States this week said that China will be held accountable for not complying with the trade deal without providing any details.
- Russia started military drills with Belarus and warned it could invade Ukraine any day. Russia has placed more than 100,000 troops along Ukraine’s border. Around 30,000 Russian troops are expected to take part in the drills, the BBC reported.

Domestic Economy & Equities

Strengths
- Initial jobless claims declined by another 16,000 week-over-week to 223,000 beating 230,000 consensuses. The continuing claims increased by 7,000 to 1,621,000, and in line with consensus.
- Despite the likelihood of U.S. rates rising much sooner and faster than previously anticipated, monetary support is not going away in the near term. The Federal Reserve’s nearly $9 trillion balance sheet is expected to remain well above the $4 trillion pre-pandemic level.
- Newell Brands, a consumer products company, was the best performing S&P 500 stock for the week, increasing 14.44%. Shares gained more than 11% on Friday after the company announced an earnings beat.
Weaknesses
- January inflation increased by 0.6% month-over-month, higher than the 0.4% consensus and in line with December’s 0.6% reading. Annualized inflation was reported at 7.5%, above the 7.3% consensus, making it the highest since February 1982.
- The interest in mortgaging a home slipped last week, according to the Mortgage Banker Association’s (MBA) Market Composite Index. For the week ending February 4, mortgage applications decreased 8.1% on a seasonally adjusted basis from one week prior.
- Lumen Technologies Inc., a telecommunications company, was the worst performing S&P 500 stock for the week, losing 19.34%. Shares declined more than 15% on Thursday after the company announced poor fourth-quarter results.
Opportunities
- Wells Fargo will return workers to the office on a hybrid basis, regardless of vaccine status, starting March 14. New York’s subway carried more than 3 million passengers Tuesday, the most since mid-December. New York state lifted its mask mandate for most businesses today. Some European countries are removing COVID restrictions altogether and the Swedish government decided to end COVID-related restrictions as well on February 9.
- Travel and leisure equites should continue to recover with many global markets deciding to ease COVID restrictions. By summer, international travel could also recover swiftly as many countries are dropping travel testing requirements.
- January retail sales and industrial production will be released next week. Bloomberg economists predict stronger readings for both. The data will be released on February 16. Later in the week we could see jobless claims and continuing claims continue to improve.
Threats
- U.S. shares fell across the board after the inflation report was released on Thursday, led by technology. Money markets are betting on 100 basis points of Federal Reserve rate hikes by July, and Guggenheim’s Scott Minerd says investors should prep for a 50 basis points hike in March.
- The U.S. 10-year Treasury yield on Thursday climbed to 2% for the first time since August 2019 after inflation data came out. The benchmark bond yield, which serves as a reference point for financial assets across the globe, has risen 0.49% so far this year.
- The initial reading of February’s consumer sentiment came in at 61.7, well below the consensus for 67.5 and January’s final reading of 67.2. This was the lowest headline reading since 2011. Current conditions and expectations components were both notably down month-over-month, also at 11-year lows.
Energy & Natural Resources
Strengths
- The best performing commodity for the week was lumber, up 13.66%, which closed up for a seventh consecutive day as builders appear to be restocking their inventory for the spring building season. Wood prices have been volatile since the onset of the pandemic spurred a building boom. Mark Wilde, an analyst at BMO Capital Markets, noted that with the seasonal ramp-up in the housing market, it wouldn’t surprise him to see prices rally even further.

- Aluminum touched the highest in more than three months, with Chinese traders returning from the Lunar New Year break in a bullish mood after inventories there rose less than expected. Chinese ingot inventories rose 19% to 866,000 tons, according to researcher Shanghai Metals Market.
- Iron ore futures in Singapore rose to the highest level in five months as signs of tighter supply and stronger demand prospects overshadowed a warning from Beijing that it will crack down on speculation. Shipments from top producing country Brazil shrank to the lowest in years amid heavier-than-normal rains last month. Flows from Australia, meanwhile, also fell in the week.
Weaknesses
- The worst performing commodity for the week was natural gas, down 12.40%. As forecasts of warmer weather across the U.S. lowers the demand for the fuel. Internationally, European gas inventories should now be sufficient to last through the end of winter under all scenarios other than a serious disruption in Russian pipeline supplies, mostly because of mild temperatures across most of Northwest Europe since Christmas. However, they could still end the winter down, and below the average for the last 10 years.
- Chinese steel production ran at 843 million tons per year, the weakest level in four years. The combination of a weak property sector, emission-related cutbacks, and power shortages were weighing on demand. However, December saw a 20% bounce in output to a 1,015 million tons per year run rate. Surprisingly, steel trader inventories also fell in December. Key risks are centered on property sector weakness, and government-mandated output cuts to reduce pollution.
- Carbon-capture projects are attracting renewed attention from investors and governments world-wide as concerns mount about the greenhouse-gas emissions linked to climate change. More than 80% of proposed commercial carbon-capture efforts around the world have failed, primarily because the technology did not work as expected or the projects proved too expensive to operate, according to a study by researchers at Canada’s Carleton University, the University of California, San Diego, and other institutions. The U.S. has spent $1.1 billion on carbon-capture demonstration projects since 2009, with uneven results, according to a December report from the Government Accountability Office.
Opportunities
- Relative to pre-pandemic times, a rising percentage of E&Ps have executive compensation tied to free cash flow, returns, and ESG. At the same time, there has been a decline in the number of companies with compensation linked to production growth. The average weighting of production as an incentive metric fell from 15% in 2019, to 14% in 2020 and 8% in 2021. Further, more than half of E&Ps have incorporated or increased the weighting of free cash flow, returns, or cost savings metrics. While these changes still leave room for the industry to resume some growth in 2022+, there may be rising emphasis on free cash flow and cash returns to limit future volume increases to well below the levels seen during the 2016-2019 cycle.
- European aluminum-exposed stocks gained after Goldman Sachs increased its price forecast for the metal, as power rationing hits supplies from China and Europe at a time of “exceptional” developed-market demand. Goldman analysts including Nicholas Snowdon say in a report that they believe “markets are facing a melt-up in prices this year, driven by simultaneous deficits in both China and ex-China drawing on an already low stock of inventory.”
- Looking at price action since the start of the pandemic, copper has traditionally rallied on periods of sequentially positive macro data – from China’s initial stimulus to the discovery of vaccines and growing developed market demand. With each rally, copper micro has tightened, reaching today’s point of record low stocks with limited inventory waiting in the wings to overcome the projected 197kt deficit this year.
Threats
- Brent oil eased following a run of seven weekly gains that has pushed crude to the highest level since 2014. Traders also continue to watch the Iran nuclear deal negotiations, with diplomats set to return to Vienna. The U.S. signed several sanctions waivers related to Iran’s civilian nuclear activities, though Tehran said it still needs guarantees from Washington to revive the deal.
- Morgan Stanley sees downside risk to 2022 natural gas prices. Current Henry Hub prices reflect a risk premium for an inventory deficit that is unlikely to materialize over the coming months. That said, for the remainder of the year rising supply should keep pace with the group’s forecasted demand growth of five bcf per day. Morgan Stanley’s 2022 forecast of $3.75/mmbtu is unchanged, implying downside to the current strip of ~$4.60/mmbtu.
- Russian gas production increased by 2% year-over-year in January mostly driven by robust demand on the domestic market. Pipeline gas exports to Europe were down by 46% year-over-year on decreased demand. European customers preferred to cut offtake volumes within take-or-pay agreements as contract pricing reflected high spot prices of November-December. Instead, increased demand for spot LNG resulted in close to 60% year-over-year growth of LNG imports.
Blockchain and Digital Currencies
Strengths
- Of the cryptocurrencies tracked by CoinMarketCap, the best performer for the week was NinjaFloki, rising 687.31%.
- Federal officials seized some $3.6 billion worth of Bitcoin tied to the 2016 hack of the crypto exchange Bitfinex, reports CoinDesk. Two individuals were arrested on Tuesday in New York on charges they conspired to launder proceeds from the Bitfinext hack.
- Billionaire investor Bill Ackman urged the New York City mayor and political leaders to remove the state’s barriers to cryptocurrency access this week on Twitter. Ackman tweeted: “NY is on its way to becoming a crypto center of innovation. Let’s remove barriers, create opportunities for growth and innovation, and help our state and city!”
Weaknesses
- Of the cryptocurrencies tracked by CoinMarketCap, the worst performing for the week was WalMeta, down 99.37%.
- Bitcoin’s drop since its November high has been so steep that the average buyer over the last couple of months is likely underwater until it once again tops $47,000, writes Bloomberg. According to Blockforce Capital, the average price investors paid for the coin over the last five months is $47,000.

- An anonymous cryptocurrency wallet holding 1,000 Bitcoins transferred its funds to Coinbase. Cryptocurrency transfers from wallets to exchanges is typically a bearish signal, writes Bloomberg. When “whales” transfer Bitcoin to exchanges it typically signals the need for liquidity and is unlikely that they will hold their Bitcoin on the exchange due to security risk.
Opportunities
- This year’s Super Bowl is now being called the “Crypto Bowl,” writes Fortune, as cryptocurrency companies are spending millions on television ads during the game. Huge crypto brands are going “head-to-head” with professional sports teams, leagues, and stars to generate industry awareness for over 100 million viewers.
- KKR is set to become the latest Wall Street name to back metaverse company Animoca Brands Corp., taking the latest funding round to about $500 million, writes Bloomberg. Animoca offers a slew of blockchain-based games in genres like car racing and tower defense.
- YouTube elaborated on its NFT plans for 2022 doubling down on the idea that the crypto assets could have huge upside potential, writes Blockworks. Neal Mohan, the Chief Product Officer at YouTube, said that “NFTs have incredible potential and allow creators to make money in ways not previously possible.”
Threats
- The creator of the cryptocurrency Skycoin claims that a former consultant and others tried to extort tens of millions of dollars with ransomware attacks, organized a plot to kidnap him and his girlfriend, and conspired to undermine the $5 billion market for the digital token, reports Bloomberg.
- The Reserve Bank of India Governor Shaktikanta Das on Thursday warned that private cryptocurrencies pose a big threat to India’s macroeconomic and financial stability, writes Bloomberg. Das said “Cryptocurrencies, which have currency-like character, will undermine the RBI’s ability to deal with financial stability issues.”
- A metric tracking Bitcoin miners’ holdings turned negative on Feb. 5 for the first time since mid-November, writes Bloomberg. According to crypto analytics platform Glassnode miners have sold their coins in a possible sign of a shakeout and manage cash, while also investing in more powerful equipment.

Gold Market
This week spot gold closed at $1,858.76, up $50.48 per ounce, or 2.79%. Gold stocks, as measured by the NYSE Arca Gold Miners Index, ended the week higher by 6.27%. The S&P/TSX Venture Index came in up 1.67%. The U.S. Trade-Weighted Dollar rose 0.56%.
| Date | Event | Survey | Actual | Prior |
|---|---|---|---|---|
| Feb-10 | CPI YoY | 7.3% | 7.5% | 4.0% |
| Feb-10 | Initial Jobless Claims | 230k | 223k | 239k |
| Feb-11 | Germany CPI YoY | 4.9% | 4.9% | 4.9% |
| Feb-15 | Germany ZEW Survey Expectation | 53.5 | — | 51.7 |
| Feb-15 | Germany ZEW Current Situation | -5.8 | — | -10.2 |
| Feb-15 | PPI Final Demand YoY | 9.0% | — | 9.7% |
| Feb-17 | Housing Starts | 1,700k | — | 1,702k |
| Feb-17 | Initial Jobless Claims | 218k | — | 223k |
Strengths
- The best performing precious metal for the week was silver, up 4.74%. The metal escalated faster than gold on the back of stronger inflation and geopolitical tensions. Gold firmed up as the week ended amid concerns over inflation after the U.S. consumer prices report for January exceeded expectation with a 7.5% year-over-year headline number. Meanwhile, tensions over Ukraine have boosted haven demand, even as Moscow has repeatedly denied that it plans to attack the country.
- Bloomberg reports that the Royal Bank of India purchased 77.5 metric tons of gold in 2021, its second largest purchase since 2009 when it bought 200 metric tons.
- Centerra Gold shares rose to their highest level since January 5 after reports that the Canadian gold miner has resolved a disagreement with Kyrgyzstan’s government over the Kumtor gold mine. Kyrgyz Prime Minister Akylbek Japarov said negotiations are “finishing up, and we’re parting ways with Centerra Gold amicably,” according to an Interfax report. Kyrgyzstan seized the gold mine from Centerra in 2021, prompting a series of claims by Centerra and a round of international arbitration.
Weaknesses
- The worst performing precious metal for the week was platinum, but still up 0.25% as precious metals moved higher across the board. Gold Fields indicated an earnings range of $0.88-0.94 per share, which is below consensus of $1.00 per share. There may be consensus earnings downgrades following detailed 2021 results on February 17.
- Money managers are becoming less bullish on gold. Money managers have decreased their bullish gold bets, with the net-long position the least bullish in 18 weeks.
- Local governments in the Philippines can impose reasonable regulation but cannot totally prohibit open-pit mines, following national government’s decision to lift the ban on mining methods, Mines and Geosciences Bureau Director Wilfredo Moncano says.
Opportunities
- Wheaton Precious Metals’ five-year annual average production guidance of 850,000 ounces from 2022-2026 and 10-year guidance of 900,000 ounces from 2022-2031 represented an improvement over its previous five-year guidance of 810,000 ounces from 2021-2025 and 10-year guidance of 830,000 ounces from 2021-2030.
- Triple Flag Precious Metals (TFPM) has announced that it has entered into agreement to acquire a 2.75% net smelter returns royalty on Monarch Mining Corporation’s Beaufor Mine gold project in Quebec, Canada for C$11.25 million. TFPM will acquire the Beaufor royalty through two transactions. First, TFPM has entered into a binding agreement with a third party to acquire an existing 2% royalty for C$6.75 million. Second, TFPM has entered into an agreement with Monarch to provide an additional C$4.5 million to increase the royalty to 2.75%.
- Newmont Mining announced that it has entered into an agreement to acquire Buenaventura’s 43.65% interest in Yanachocha for $300 million plus up to $100 million in contingent payments. NEM’s Yanacocha sulfides project is expected to add average annual production of 525,000 gold equivalent ounces per year with a cash cost of $700-800 an ounce in the first five full years of production.
Threats
- Platinum miners in Zimbabwe asked the government to push back a tax on exports of semi-processed metals, requesting more time to invest in processing plants at home. The Treasury announced the tax in 2020, giving miners two years to prepare before its planned introduction early this year. The levy of as much as 5% is aimed at spurring the companies to develop their own processing facilities, allowing Zimbabwe to increase the value of its mineral resources.
- There may be upward cost pressure. Miners flagged the inflationary cost pressures and recognized increases in reagents, consumables, labor costs and, of course, fuel costs. Capital projects are seeing a more material increase on budgets due to inflation. Feasibility study updates have shown a real trend of increasing capital spending. The magnitude has varied given that inflation is only one part of the equation, with scope changes also attributing to capital spending increases lately.
- Gold risks a big drop according to market pendants. This conundrum of real rates moving back toward zero, reducing gold’s allure, while the dollar recently hit its strongest since mid-2020. Yet, gold holding out, trading above $1,800 an ounce. Yes, the Federal Reserve is going to raise rates, but gold is going to keep on climbing, as the Fed is behind the curve, and with the long end of the yield curve so low the Fed may be limited in how fast they can raise rates.

U.S. Global Investors, Inc. is an investment adviser registered with the Securities and Exchange Commission (“SEC”). This does not mean that we are sponsored, recommended, or approved by the SEC, or that our abilities or qualifications in any respect have been passed upon by the SEC or any officer of the SEC.
This commentary should not be considered a solicitation or offering of any investment product. Certain materials in this commentary may contain dated information. The information provided was current at the time of publication. Some links above may be directed to third-party websites. U.S. Global Investors does not endorse all information supplied by these websites and is not responsible for their content. All opinions expressed and data provided are subject to change without notice. Some of these opinions may not be appropriate to every investor.
Holdings may change daily. Holdings are reported as of the most recent quarter-end. The following securities mentioned in the article were held by one or more accounts managed by U.S. Global Investors as of (12/31/2021):
Norilsk Nickel
Spirit Airlines
SkyWest Inc.
Wizz Air Holdings PLC
Ryanair Holdings PLC
Allegiant Travel Co.
United Airlines Holdings Inc.
Japan Airlines Co. Ltd.
Expedia Group Inc.
Hilton Worldwide Holdings Inc.
Royal Caribbean Cruises Ltd.
Tripadvisor Inc.
Booking Holdings Inc.
Trip.com Group Ltd.
Airtrip Corp.
Qantas Airways Ltd.
Centerra Gold Inc.
Gold Fields Ltd.
Wheaton Precious Metals Corp.
Triple Flag Precious Metals Co.
Newmont Corp.
*The above-mentioned indices are not total returns. These returns reflect simple appreciation only and do not reflect dividend reinvestment.
The Dow Jones Industrial Average is a price-weighted average of 30 blue chip stocks that are generally leaders in their industry. The S&P 500 Stock Index is a widely recognized capitalization-weighted index of 500 common stock prices in U.S. companies. The Nasdaq Composite Index is a capitalization-weighted index of all Nasdaq National Market and SmallCap stocks. The Russell 2000 Index® is a U.S. equity index measuring the performance of the 2,000 smallest companies in the Russell 3000®, a widely recognized small-cap index.
The Hang Seng Composite Index is a market capitalization-weighted index that comprises the top 200 companies listed on Stock Exchange of Hong Kong, based on average market cap for the 12 months. The Taiwan Stock Exchange Index is a capitalization-weighted index of all listed common shares traded on the Taiwan Stock Exchange. The Korea Stock Price Index is a capitalization-weighted index of all common shares and preferred shares on the Korean Stock Exchanges.
The Philadelphia Stock Exchange Gold and Silver Index (XAU) is a capitalization-weighted index that includes the leading companies involved in the mining of gold and silver. The U.S. Trade Weighted Dollar Index provides a general indication of the international value of the U.S. dollar. The S&P/TSX Canadian Gold Capped Sector Index is a modified capitalization-weighted index, whose equity weights are capped 25 percent and index constituents are derived from a subset stock pool of S&P/TSX Composite Index stocks. The NYSE Arca Gold Miners Index is a modified market capitalization weighted index comprised of publicly traded companies involved primarily in the mining for gold and silver. The S&P/TSX Venture Composite Index is a broad market indicator for the Canadian venture capital market. The index is market capitalization weighted and, at its inception, included 531 companies. A quarterly revision process is used to remove companies that comprise less than 0.05% of the weight of the index, and add companies whose weight, when included, will be greater than 0.05% of the index.
The S&P 500 Energy Index is a capitalization-weighted index that tracks the companies in the energy sector as a subset of the S&P 500. The S&P 500 Materials Index is a capitalization-weighted index that tracks the companies in the material sector as a subset of the S&P 500. The S&P 500 Financials Index is a capitalization-weighted index. The index was developed with a base level of 10 for the 1941-43 base period. The S&P 500 Industrials Index is a Materials Index is a capitalization-weighted index that tracks the companies in the industrial sector as a subset of the S&P 500. The S&P 500 Consumer Discretionary Index is a capitalization-weighted index that tracks the companies in the consumer discretionary sector as a subset of the S&P 500. The S&P 500 Information Technology Index is a capitalization-weighted index that tracks the companies in the information technology sector as a subset of the S&P 500. The S&P 500 Consumer Staples Index is a Materials Index is a capitalization-weighted index that tracks the companies in the consumer staples sector as a subset of the S&P 500. The S&P 500 Utilities Index is a capitalization-weighted index that tracks the companies in the utilities sector as a subset of the S&P 500. The S&P 500 Healthcare Index is a capitalization-weighted index that tracks the companies in the healthcare sector as a subset of the S&P 500. The S&P 500 Telecom Index is a Materials Index is a capitalization-weighted index that tracks the companies in the telecom sector as a subset of the S&P 500.
The Consumer Price Index (CPI) is one of the most widely recognized price measures for tracking the price of a market basket of goods and services purchased by individuals. The weights of components are based on consumer spending patterns. The Purchasing Manager’s Index is an indicator of the economic health of the manufacturing sector. The PMI index is based on five major indicators: new orders, inventory levels, production, supplier deliveries and the employment environment. Gross domestic product (GDP) is the monetary value of all the finished goods and services produced within a country’s borders in a specific time period, though GDP is usually calculated on an annual basis. It includes all private and public consumption, government outlays, investments and exports less imports that occur within a defined territory.
Free cash flow indicates the amount of cash generated each year that is free and clear of all internal or external obligations.
M2 Money Supply is a broad measure of money supply that includes M1 in addition to all time-related deposits, savings deposits, and non-institutional money-market funds.
Mortgage Bankers Association of America Market Index covers all mortgage applications during the week. This includes all conventional and government applications, all fixed-rate mortgages (FRMs), all adjustable-rate mortgages (ARMs), whether for a purchase or to refinance.