


Rate Cuts, Trade Wars and Gold: 5 Things Every Investor Should Know Right Now
Date Posted: August 2, 2019
Read time: 54 min
NULL
By Frank Holmes
CEO and Chief Investment Officer
U.S. Global Investors
Say what you will about this past week, it certainly wasn’t dull. The Federal Reserve, seemingly capitulating to President Donald Trump and Wall Street, became just the latest central bank to cut interest rates. Meanwhile, the president escalated the trade war even further, announcing that additional tariffs would be imposed on goods coming into the U.S. from China after another round of trade talks failed to deliver a satisfactory resolution.
Oh, and gold closed out July with a third straight month of gains.
Read on for five things I believe every investor should know right now.
1. August has a rocky history. Time to get defensive?
It’s been a good year for stocks so far, with the S&P 500 up about 19 percent as of the end of July. But here at the start of August, it may be time for investors to get cautious, if history is any indication. Since 1950, August has been the worst performing month, giving back 0.05 percent on average, according to LPL Research. It’s also been the weakest month in the past 10-year and 20-year periods.
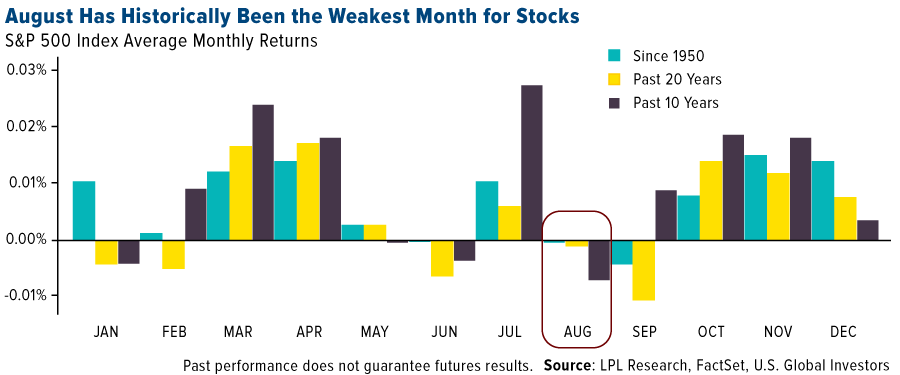
August wasn’t always such a bummer. Between 1901 and 1951, the U.S. harvesting season made it the best month for stocks. But now that only 2 percent of Americans work in agriculture, August has sunk to the very bottom.
More recently, incidental geopolitical and economic concerns have roiled markets in the eighth month. Think Iraq’s invasion of Kuwait in 1990. Or the Asian contagion in 1997. Or the U.S. debt downgrade in 2011.
The way things are shaping up, we could be in for another rocky August…
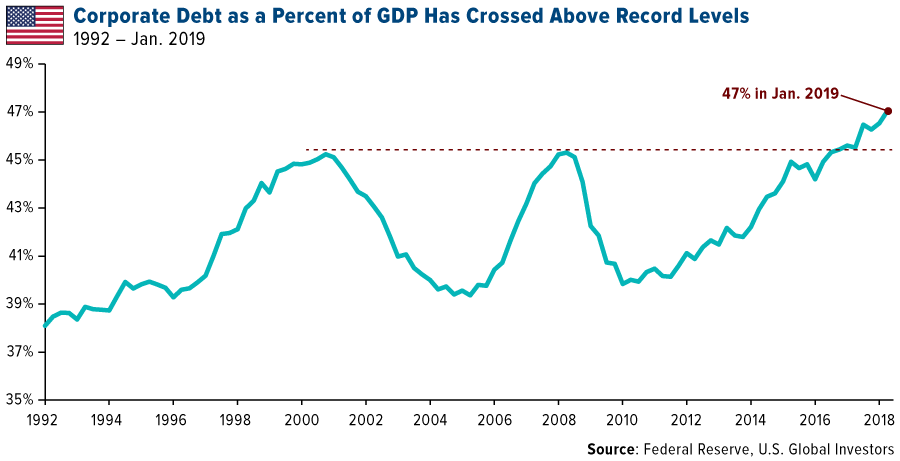
2. The Fed capitulates, making the corporate debt bubble even more precarious.
I’ve already shared some of my thoughts with you on this week’s rate cut by the Fed. Lower (and potentially negative!) real and nominal yields here in the U.S. should spur investor demand for more reliable stores of value, such as gold, which I’ll talk about in a moment.
Another consequence of rock-bottom rates—as we’ve seen over the past decade since the end of the financial crisis—is greater debt loads. Corporate debt is already at a historic high as a percent of U.S. GDP, and it’s feared that the Fed’s move, coupled with the expectation of further cuts, could encourage even more risky borrowing. At the end of 2018, corporate debt stood at a whopping $5.7 trillion, two and a half times greater than the $2.2 trillion companies owed a decade earlier.
Even more concerning is the fact that the largest and fastest growing segment of investment-grade debt is rated BBB—which is just above junk status. In May, S&P Global reported that the value of U.S. BBB-rated bonds exceeded $3 trillion for the first time ever, accounting for more than half of the entire investment-grade bond universe.
In the event of an economic downturn, highly leveraged companies could risk seeing their debt downgraded to less than investment-grade, making interest payments more expensive. Lenders that have participated in risky loans could therefore be particularly vulnerable.
And while I’m on the topic of debt, the U.S. Treasury announced this week that its issuance of long-term debt would hold steady at a record $84 billion for the third consecutive quarter. This tops the previous record Treasury issuance, set in 2009, when the country was recovering from the worst economic pullback since the Great Depression. Borrowing by the U.S. government is now on track to exceed $1 trillion for the second straight year. It’s now estimated that, by 2024, all U.S. government debt issuance will be used only to pay interest on past debt.
3. Trump’s trade war is taking a huge toll on corporate earnings.
Yesterday, President Trump announced via Twitter that the U.S. would impose a 10 percent tariff on $300 billion of imports from China, effective September 1. This is on top of the 25 percent tariff that’s already in place on $250 billion worth of Chinese-made goods—meaning nearly everything the U.S. buys from its once-top trading partner will now be taxed (and paid for by American importers and consumers, I should add).
I say “once-top” because, as the Wall Street Journal reports today, China lost its spot as America’s number one trading partner thanks to tensions between the two countries. In the first six months of 2019, imports from China fell 12 percent compared to the same period a year earlier, while exports fell 18 percent. The total value of bilateral trade, at nearly $290 billion, dropped below that of both Canada and Mexico for the first time in more than a decade.
As you might imagine, this is having a noticeably negative impact on earnings of U.S.-based, multinational companies. According to FactSet, firms that generate more than half of their revenues overseas have seen their bottom line plunge as much as 13.6 percent quarter-over-quarter. That’s compared to a 3.2 percent increase in earnings for companies with less global revenue exposure, and an average 2.6 percent decline for all S&P 500 companies that have reported so far.

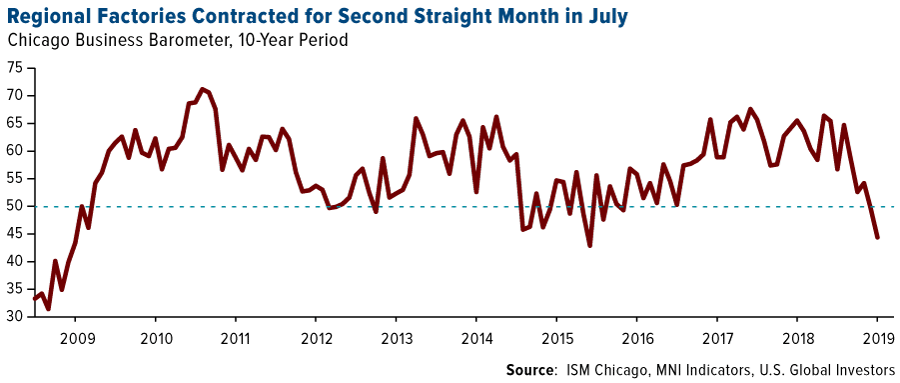
4. Tariffs are also hurting manufacturing growth, both here and abroad.
U.S. factories are having their worst start to the third quarter since the end of the financial crisis. The purchasing managers’ index (PMI) posted a 50.4 in July, its lowest reading since September 2009 despite being slightly higher than earlier forecasts. Employment contracted for only the second time in about 10 years, suggesting “the goods-producing sector is on course to act as a significant drag on the economy in the third quarter,” writes Chris Williamson, chief business economist at IHS Market.
The Chicago Business Barometer, often seen as a bellwether of the U.S. economy, fell further below the neutral 50.0 level in July. The indicator touched 44.4, down from 49.7 the previous month, with production falling 22 percent to hit a 10-year low. Some factories are holding tariffs directly responsible for the slowdown, according to the monthly report.
The downturn isn’t confined to the U.S., of course. The Global Manufacturing PMI continued to contract for the third consecutive month in July, falling to 49.3, its lowest reading since October 2012.
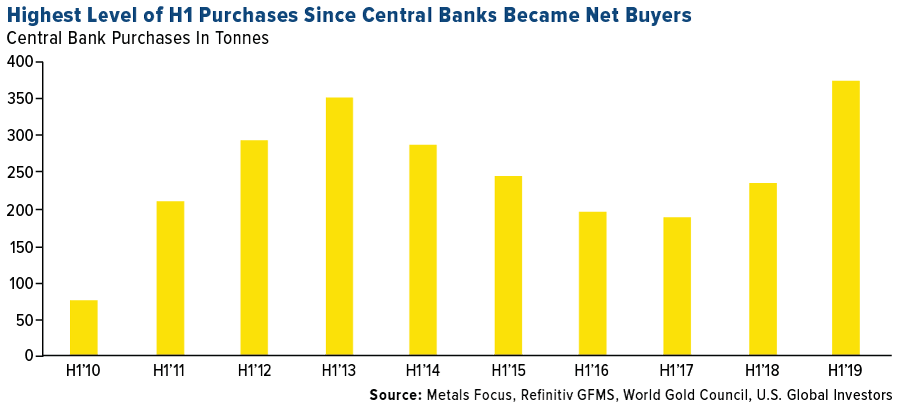
5. Gold demand just had its best first half of the year in three years.
Given the considerable risks right now, is it any wonder that gold has performed so well this year? Today, the yellow metal touched $1,460 in intraday trading, up 11.25 percent from the beginning of January.
Gold demand in the first half of 2019 was its best in three years, climbing to 2,181.7 tonnes, largely due to increased appetite for gold-backed ETFs as well as record buying by central banks. Bank purchases of bullion rose an incredible 47 percent year-over-year in the second quarter, pushing the total amount for the January-to-June period to its highest since central banks became net buyers of gold in 2010. Poland was the top buyer—ahead of Russia, even—with reserves growing 77 percent to 100 tonnes.
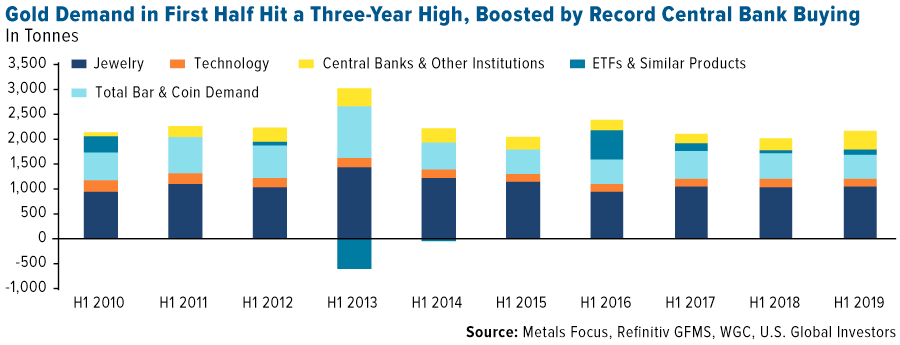
Meanwhile, investors added some 67.2 tonnes to their holdings of gold-backed ETFs in the second quarter. This took total holdings to a six-year high of 2,548 tonnes. Among the factors driving demand were geopolitical uncertainty, global negative yields and a rising gold price.
Treasury yields are falling. Could they drop below zero? Read my thoughts and more in this week’s Frank Talk by clicking here!

Gold Market
This week spot gold closed at $1,440.60, up $21.80 per ounce, or 1.54 percent. Gold stocks, as measured by the NYSE Arca Gold Miners Index, ended the week higher by 1.35 percent. The S&P/TSX Venture Index came in up just 0.48 percent. The U.S. Trade-Weighted Dollar ended the week higher by only 0.08 percent.
| Date | Event | Survey | Actual | Prior |
|---|---|---|---|---|
| Jul-30 | Germany CPI YoY | 1.5% | 1.7% | 1.6% |
| Jul-30 | Conf. Board Consumer Confidence | 125.0 | 135.7 | 124.3 |
| Jul-31 | Eurozone CPI Core YoY | 1.0% | 0.9% | 1.1% |
| Jul-31 | ADP Employment Change | 150k | 156k | 112k |
| Jul-31 | FOMC Rate Decision (Upper Bound) | 2.25% | 2.25% | 2.25% |
| Jul-31 | Caixin China PMI Mfg | 49.5 | 49.9 | 49.4 |
| Aug-1 | Initial Jobless Claims | 214k | 215k | 207k |
| Aug-1 | ISM Manufacturing | 52.0 | 51.2 | 51.7 |
| Aug-2 | Change in Nonfarm Payrolls | 165k | 164k | 193k |
| Aug-2 | Durable Goods Orders | — | 1.9% | 2.0% |
| Aug-8 | Initial Jobless Claims | 215k | — | 215k |
| Aug-9 | PPI Final Demand YoY | 1.7% | — | 1.7% |
Strengths
- The best performing metal this week was gold, up 1.54 percent. Gold investors were stocking up for further gains in the yellow metal ahead of the Fed’s rate cut decision. On Wednesday, holdings in bullion-backed ETFs rose 4.8 tons to the highest level since April 2013, according to Bloomberg data. Gold did fall that same day after the rate cut was announced, but rebounded sharply on Thursday thanks to President Trump’s additional tariffs on Chinese imports.
- Gold saw its third-straight monthly gain in July, locked in by the above mentioned rate cut and U.S.-China trade tensions. U.S. Mint data shows that American Eagle gold coin sales rose 10 percent in July to 5,500 ounces for a second monthly increase.
- Demand for the yellow metal is at a three-year high largely driven by central banks. Globally, central banks added 374.1 tonnes to their reserves in the first six months of this year, according to the World Gold Council. Turkey’s reserves rose $164 million last week from the prior week. Azerbaijan’s sovereign wealth fund increased its gold holdings by a whopping 33 percent in the second quarter of this year.
Weaknesses
- The worst performing metal this week was palladium, down 8.06 percent on the impact more tariffs may have on trade and automobile production. Gold fell sharply on Wednesday immediately following the Fed’s decision to cut rates as traders viewed the comments as signaling the central bank likely won’t be aggressive in lowering rates further. Consumer confidence in July rose sharply to 135.7 versus estimates of just 125.0. However, U.S. manufacturing activity fell in July to an almost three-year low due to slower production and shaky export markets, reports Bloomberg.
- De Beers, the world’s largest diamond producer, saw its sales fall to the lowest since 2015 after it allowed its customers to defer more purchases to later this year, reports Bloomberg. The diamond industry is struggling to make profits as demand slumps due to a surplus in polished stones. Fresnillo, a Mexican gold and silver miner, reported a 69 percent drop in profit in the first half of the year and signaled that production may decline further. The company’s shares sunk as much as 22 percent in London, according to Bloomberg.
- According to the World Gold Council, gold recycling in India is forecast to climb to the highest since 2012 due to a surge in local prices for the metal. Bloomberg’s Swansy Afonso reports that higher scrap supply in the world’s second largest consuming nation may reduce its dependence on overseas purchases. On a more positive note, India is exploring setting up bullion exchanges that could transform the nation’s gold market and make it more liquid.
Opportunities
- As the gold price continues to heat up, so too does M&A activity among gold miners. Resolute Mining Ltd. agreed to buy Toro Gold Ltd. for $274 million in cash and stock. Toro is private and operates its flagship asset in eastern Senegal. Citigroup is maintaining its third quarter average price forecast for the yellow metal at $1,425 per ounce.
- Silver continues to pull in speculation from investors. The combined volume of calls and puts for silver soared to 218,000 contracts in July – the highest since November 2010. Bloomberg’s Justina Vasquez writes that silver is getting a boost, just like gold is, due to the prospect of central banks easing monetary policy. Investors are betting that silver will catch up to gold in terms of price gains.
- Signs of economies slowing around the globe and geopolitical uncertainty ever-rising are giving gold a boost on safe haven demand. The New York Fed gauge of the probability of a recession in the next 12 months is at the highest since 2008. China’s PMI is still in contractionary territory and the uncertainty surrounding Brexit continues to weigh on markets. James Steel, chief precious metals analyst at HSBC Securities says “increasing your gold holdings is probably a judicious thing to do because it is one of the few things you can buy that is liquid and is on nobody else’s credit.”
Threats
- The Treasury Department is expected to hold its quarterly note and bond sales at record levels for the third straight time, writes Bloomberg, as Washington’s latest budget deal shows that the U.S.’s debt binge will continue. Despite President Trump at one time promising to eliminate national debt, now he is set to approve a budget that will surely usher in “trillion-dollar annual deficits,” the article continues. A different report from Bloomberg goes on to point out that borrowing is surging in the wake of Republican-backed tax cuts that have lifted economic growth and pushed unemployment lower.
- For years, De Beers has been selling its gems through 10 various sales each year in Botswana, writes Bloomberg, with “sightholders” – or buyers – having to accept both price and quantity being offered. This system is designed to benefit both miner and customer who is receiving the diamonds at a discounted rate. However, the discount has been shrinking and some sightholders are struggling to make money from a once lucrative business. The two problems here are: 1) high-end jewelry sales are stagnating, with other luxury offerings crowding the space, and 2) it’s harder for diamond trading companies to find financing because banks are abandoning the sector due to fraud and bad loans, the article explains.
- The former Citigroup analyst who coined the term “plutonomy” in the mid-2000s, Ajay Kapur, is now saying it may be time to unwind that trade, reports Bloomberg. Plutonomy essentially boiled down to an investment thesis that said “buy the stuff rich people like.” Now a political backlash is brewing, the article explains, after the wealth gap in the U.S. is widening. Democratic contenders for the 2020 presidential election support measures to narrow the gap, and even Trump’s party has shown support for curbs on share buybacks and the power of tech firms. Kapur, who is now with Bank of America Merrill Lynch in Hong Kong, says things like oligopoly power and lower taxes are subject to change. “No one is ready for this new world,” he said.

Index Summary
- The major market indices finished down this week. The Dow Jones Industrial Average lost 2.60 percent. The S&P 500 Stock Index fell 3.10 percent, while the Nasdaq Composite fell 3.92 percent. The Russell 2000 small capitalization index lost 2.87 percent this week.
- The Hang Seng Composite lost 4.84 percent this week; while Taiwan was down 3.15 percent and the KOSPI fell 3.30 percent.
- The 10-year Treasury bond yield fell 22 basis points to 1.84 percent.
Domestic Equity Market
Strengths
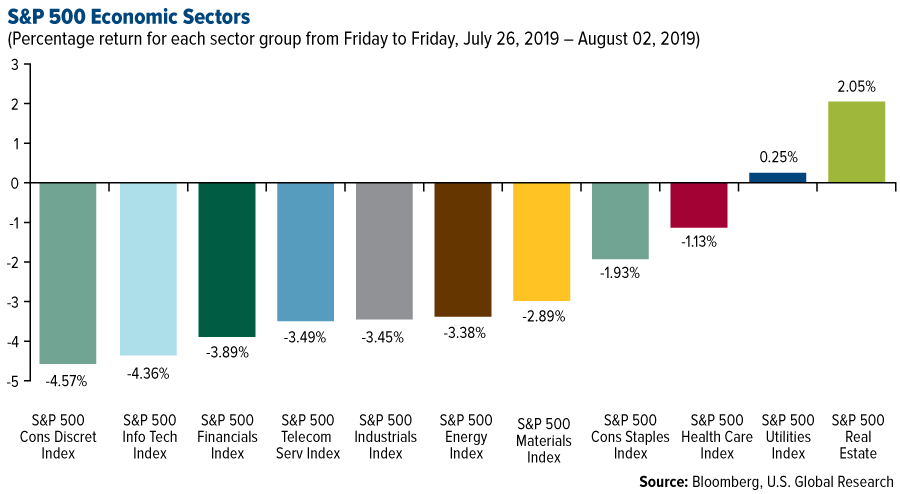
- Real estate was the best performing sector of the week, increasing by 2.05 percent versus an overall decrease of 3.10 percent for the S&P 500.
- Corteva was the best performing stock for the week, increasing 10.46 percent.
- Pinterest’s stock popped more than 12 percent after beating Wall Street’s second quarter targets. Pinterest’s $261 million in revenue for the second quarter was higher than analysts anticipated and up 62 percent from the same period the year prior.
Weaknesses
- Consumer discretionary was the worst performing sector for the week, decreasing by 4.57 percent versus an overall decrease of 3.10 percent for the S&P 500.
- Abiomed was the worst performing stock for the week, falling 26.42 percent.
- Fitbit shares tanked in after-hours trading after the firm posted weaker guidance for its third quarter, on weaker-than-expected sales of its Fitbit Versa Lite smartwatch. The firm posted a loss of 14 cents per share on $314 million in revenue.
Opportunities
- Cloudflare, a cybersecurity company last valued at $3.2 billion, plans to go public in September, according to sources familiar with the company. The company confidentially filed an S-1 with the Securities and Exchange Commission earlier in the summer, one person said.
- Facebook is reportedly working on a new Portal video chat device, which also connects to TV and features streaming services. The company has approached Netflix, Hulu and Amazon about putting their services onto the device, according to The Information.
- Airbus more than doubled its profits, pulling further ahead in its fight for aviation supremacy with crisis-hit rival Boeing. Adjusted operating profit for the first half of 2019 reached 2.53 billion euros ($ 2.82 billion) — a 118 percent increase compared to 1.16 billion euros in the first half of 2018.
Threats
- Signals for an upcoming recession are now all flashing at the same time. Despite the Fed rate cut, the yield curve is stuck in an inverted ‘recession’ mode, stocks are plunging and manufacturing is in retreat.
- Impossible Foods just won an FDA nod to sell its fake meat in stores, and Beyond Meat shares tanked on the news. In premarket trading on Thursday, Beyond Meat was down 6 percent, wiping over $700 million off its market capitalization. Furthermore, the company reported second-quarter earnings Monday that showed the company lost more money than analysts expected.
- Citigroup is reportedly cutting hundreds of jobs this year — another sign the slump in trading is here to stay. 10 percent of the bank’s equities unit will be lost in the cuts.
The Economy and Bond Market
Strengths
- A second consecutive 0.3 percent month-over-month rise in average hourly earnings pushed the year-over-year pace of wage growth to 3.2 percent. This remained well above the 1.6 percent gain in the consumer price index (CPI) registered in June, suggesting consumer spending should remain strong. The mood among Americans has remained stable amid low unemployment that’s helping to underpin personal consumption.
- U.S. consumer sentiment held steady in July near historically elevated levels while expectations improved in the later part of the month as a strong labor market helped to offset worries about slower global growth and trade tensions. The University of Michigan’s final sentiment index held at 98.4, matching the preliminary reading and up slightly from 98.2 in June, data showed Friday. The gauge of expectations improved slightly to 90.5, the best since September, while the measure of current conditions eased somewhat to 110.7
- The labor force participation rate unexpectedly ticked up to 63.0 percent in July, reaching the highest level since March and showing more workers either employed or actively looking for work. The U-6 measure of unemployment—a broad metric capturing both the unemployed and those too discouraged to seek out work—declined to 7.0 percent in July, the lowest level since December 2000.
Weaknesses
- The yield on the 10-year Treasury note fell to its lowest level since November 2016 on an intraday basis Thursday as investors weighed the latest in the U.S.-China trade standoff. President Donald Trump said in a tweet that he would impose a 10 percent tariff on $300 billion in Chinese imports that aren’t yet subject to duties, starting September 1.

- The U.S. economy added slightly fewer jobs than expected in July, with hiring coming in at 164,000 versus expectations of 165,000. Friday’s report included several downward revisions to previous data, shaving in aggregate 41,000 new employment additions off May and June’s reports. June’s change in non-farm payrolls was downwardly revised to see just 193,000 additions, from the 224,000 seen previously. And May’s previous reading of just 72,000 additions was cut further to 62,000.
- The Federal Reserve cut interest rates by 25 basis points in its policy-setting meeting on July 31, marking the first time the central bank has reduced the benchmark interest rate since it battled the financial crisis in 2008. The Fed also decided to pre-emptively end its process of shrinking its balance sheet, a process known as quantitative tightening, two months ahead of schedule. The cut, which takes the target benchmark rate to a range of 2 percent to 2.25 percent, comes as the Fed continues to worry about a possible slowdown in the U.S. economy.
Opportunities
- Monday’s U.S. non-manufacturing PMI will be an important indicator of the service side of the economy which has shown resilience despite headwinds from the trade war.
- White House economic adviser Larry Kudlow played down the impact on U.S. consumers of additional tariffs on Chinese imports and suggested Beijing could strengthen the case for avoiding them being applied next month if they bought U.S. agricultural products. “From our talks internally, that would be a plus,” Kudlow said Friday in an interview on Bloomberg television. “That would be a very good plus if they start buying agricultural products in size. It would certainly help the story.”
- After a Fed rate cut on Wednesday, money managers like T. Rowe Price and Goldman Sachs Asset Management are looking closely at lower-rated blue-chip bonds and even some of the riskiest junk debt. That’s a shift from earlier this year, when investors were often reluctant to buy notes from companies that could be hit harder by an economic downturn. Their growing willingness to buy signals that at least some money managers, like economists, aren’t expecting a serious recession in the near term, even if they fret about slowing growth and signs of manufacturing weakness. Lower-rated debt often matures sooner than higher-rated instruments, while also offering higher yields.
Threats
- Trade numbers out of China will attract attention next Thursday amid a fresh escalation in the long-running trade conflict with the U.S. after President Trump this week decided to slap 10 percent tariffs on the remaining $300 billion worth of Chinese imports, breaking the truce agreed at the G20 summit. Exports from China are forecast to have fallen on an annual basis for a second straight month in July, by 2.2 percent, worsening from the prior 1.3 percent drop. Imports are also expected to have decreased at a sharper rate, by 7.6 percent.
- Traders are more convinced that the Fed will cut interest rates again after Trump abruptly escalated his trade war with China by announcing new tariffs. The rate on the January fed funds futures contract implies that the central bank’s benchmark will fall to 1.645 percent by the end of 2019. That suggests the market is pricing in just over 50 basis points of easing in addition to the reduction announced by the central bank on Wednesday as it strives to keep the economic expansion afloat.
- U.S. manufacturing activity slowed to a near three-year low in July as the negative effects of a bitter trade war between the United States and China lingered. The Institute for Supply Management (ISM) said its index of national factory activity slipped to 51.2 last month, the lowest reading since August 2016, from 51.7 in June. It was the fourth straight monthly decline in the index.
Energy and Natural Resources Market
Strengths
- The best performing major commodity for the week was lumber, which gained 9.50 percent in the futures market with the news of more Canadian mills cutting production.
- Although the announcement of more tariffs on Chinese imports by the U.S. is negative for many companies and metal prices, it was a positive boost for China’s rare earth producers. China has a stranglehold over the global supply of rare earths. Bloomberg reports that three of the largest producers rose between 7 and 16 percent on Friday morning.
- Saudi Arabia is filling the supply gap for oil that was left when waivers for Iran imports ended. China’s oil purchases from the massive producer rose 64 percent month-over-month in June to 1.89 million barrels a day, according to data from China’s General Administration of Customs. China’s imports from Iran fell to the lowest since May 2010, reports Bloomberg.
Weaknesses
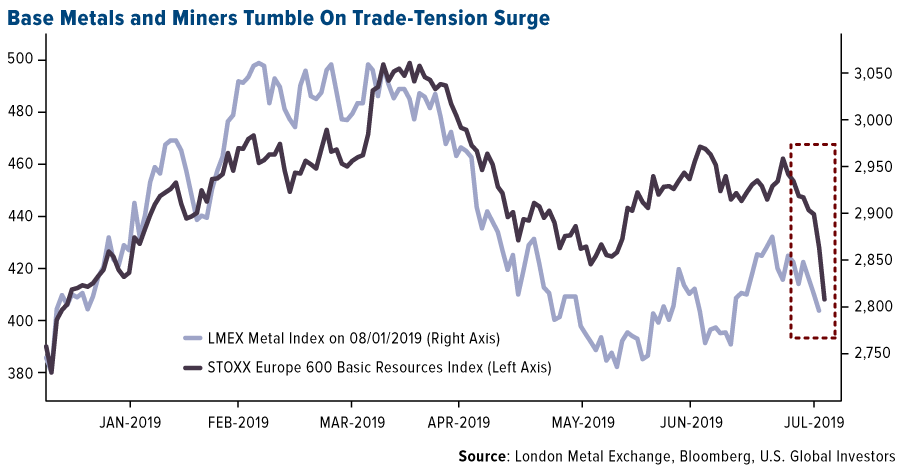
- The worst performing major commodity for the week was cotton, which fell 8.25 percent. Base metals and miners, in addition to agricultural products, took a big tumble late in the week after President Donald Trump announced a new round of tariffs on the remaining Chinese imports that weren’t already tariffed. The announcement of the tariffs, set to take effect on September 1, came as a shock to markets globally as talks between the U.S. and China had just resumed. WTI crude oil fell nearly 8 percent on Thursday while the Stoxx Europe 600 Basic Resources index is set for its worst week in 2016. The Bloomberg Commodity Spot Index fell 2.5 percent on Thursday, the biggest one-day drop in more than 12 months.
- Iron ore continues to fall, with many banks believing there will be a slump back below $100 per ton. According to Bloomberg, prices in China have fallen into a bear market from a peak last month, losing more than 20 percent. Futures in Singapore sunk almost 7 percent this week. Vale SA, the world’s largest producer, announced production would increase in the second half of this year after slowing in Brazil due to a dam disaster. Morgan Stanley said in a report that “more ore is arriving in China, while demand is slowing.”
- Metallurgical coal prices are also falling, with the benchmark down over $40 per metric ton as of Thursday from June 1. Peabody Energy and Warrior Met Goal both fell as much as 11 percent. India, the world’s second largest buyer, also announced that it is preparing to cut coal imports by a third and move toward domestic clean energy.
Opportunities
- Nutrien Ltd., the world’s top fertilizer maker, is planning a $1 billion investment in Brazil, as a weaker global farm economy presents acquisition opportunities, reports Bloomberg. Denitsa Tsekova writes that the company’s plan will increase competition for U.S. fertilizer maker Mosaic Co. and Norway’s Yara International ASA.
- According to new research from BloombergNEF, falling battery prices could spur a $662 billion investment boom in stationary energy storage that could grow global capacity 100-fold by 2040. Battery costs fell by 85 percent from 2010 to 2018 and are projected to fall by an additional 50 percent by 2030.
- Oil tycoon T. Boone Pickens’ ETF is replacing crude with renewables. Bloomberg reports that the BP Capital Fund Advisors LLC fund plans to swap out one of its crude investment vehicles for renewables, after seeing opportunity with clean energy. Toby Loftin, the firm’s founder, says “a guy that was a good old-fashioned wildcatter is now saying that solar and wind and geothermal and biomass, that we need to embrace it.”
Threats
- Lithium supply is outpacing demand for electric vehicles, which could spell big trouble for producers of the metal heavily used in batteries. Analysts at Macquarie Capital Ltd. wrote in a report that “the latest EV data did reveal slowing growth, inferring that on top of excess supply, demand is now a problem.” They added that “they key interest for investors should be who is likely to survive” out of the miners. Lithium output in Australia is expected to rise about 23 percent over the next two years
- Archer-Daniels-Midland Co., one of the world’s largest ethanol producers, said on Thursday that its main risk to its goal of matching earnings levels of last year is a continuation of the U.S.-China trade war, according to Bloomberg. The company, among others, is facing the issue of a lack of ethanol sales to China. With the trade war ramping up this week with the announcement of additional tariffs on Chinese imports, this could spell more trouble for ethanol producers.
- According to Bloomberg NEF’s New Energy Outlook, global coal generation will peak in 2026. This calls into question the viability of 311 gigawatts of coal-fired plants now under construction, which represents $174 billion of new capital, writes BNEF’s Jeff Callens. Existing coal plants are already being underutilized consistently.

Emerging Europe
Strengths
- Romania was the best performing country this week, gaining 1.2 percent. OMV Petrom, an oil and gas producer, was the best performing equity trading on the Bucharest exchange after releasing mixed second-quarter results.
- The Turkish lira was the best performing currency this week, gaining 2.2 percent against the U.S. dollar. The country’s inflation expectation was revised down, and funds continue flow to the country as Turkey has one of the world’s highest yielding bonds.
- Health care was the best performing sector among eastern European markets this week.
Weaknesses
- Turkey was the worst performing country this week, losing 3.1 percent. After a disappointing Fed announcement on Wednesday, Turkish equites sold off the most, following a very strong uptrend in the month of July. Turkish equites gained 10.4 percent in July compared to a gain of just 60 basis points in the MSCI Emerging Market Index.
- The Russian ruble was the worst performing currency in the region this week, losing 2.9 percent. The U.S. Senate approved a bill that would sanction companies helping Gazprom to build the Nord Stream 2 project. In addition, Trump released an executive order to impose sanctions on countries for using chemical or nuclear weapons. A second round of sanctions on Russia for poisoning Srkipal’s family last year in the U.K. is more likely now.
- Finance was the worst performing sector among eastern European markets this week.
Opportunities
- Eurozone’s final Manufacturing PMI for July came in at 46.5, slightly better than the preliminary reading of 46.4, but still below the 50 level that separates growth from contraction. Core inflation also declined to just 90 basis points from 1.1 percent. Gross domestic product slowed down as well; the eurozone area recorded economic growth of only 1.1 percent on a year-over-year basis. With weak data being reported, Mario Draghi may announce more stimulus in September, a move that should be supportive for equites.
- Reuters reports that Greece’s central bank has recommended to the government that it fully remove capital controls in September or October, a step indicating a strengthening economy and banking sector. Capital controls were introduced four years ago to protect the country’s banks during a financial crisis. This week Greece reported July’s Manufacturing PMI ay 54.6, the highest in Europe.
- The new president of Ukraine Volodymyr Zelenskiy wants to implement reforms, sell state companies, trim the budget deficit and relax rules for land ownership. Prior leaders of the country had suggested similar changes but failed to implement them. Perhaps this president will have more success.
Threats
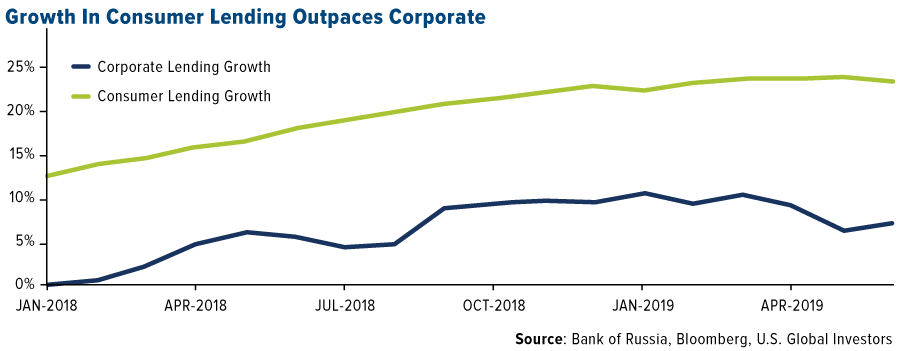
- The Russian economy minister in a radio interview said that the economy would definitely fall into recession if the central bank does not act. He worries about the rapid growth of consumer lending, which grew 25 percent last year, while corporate lending is not expanding. For a third of consumer borrowers, debt payments take up more than 60 percent of their monthly income. Many borrowers refinance their loans, simply knowing that they will not be able to pay.
- The Turkish Treasury will revise up its targets for debt sales and budget deficits this year and have discussed these plans with local banking officials. Those sales must be boosted in order to cover a budget deficit that may come in close to -3 percent of GDP versus -1.8 percent targeted. Turkish fundamentals may deteriorate further.
- Trump threatened to impose additional sanctions on China, sending the Brent crude oil price lower due to expected lower demand for the commodity. Next, Trump may move toward Europe and threat or impose more tariffs on the European car industry. With the EU’s Manufacturing PMI below the 50 level and intensifying, trade talks along with more BREXIT worries, Europe may remain under geopolitical pressure.
China Region
Strengths
- The best performing index in the region for the week was Indonesia’s Jakarta Composite, which climbed 24 basis points, a green island in a sea of relative red.
- The best performing sector in a red, risk-off week for Hong Kong’s Hang Seng Composite Index was the safe-haven utilities, which declined only 86 basis points.
- China’s official read on its Manufacturing PMI, while still contractionary, beat expectations and stabilized at 49.7, up from 49.4 and ahead of an expected 49.6 print. The Caixin China Manufacturing PMI also beat, clocking in at 49.9, ahead of expectations for a 49.5 reading and up from last month’s 49.4.
Weaknesses
- The worst performing index in the region for the week was the Hang Seng Composite in Hong Kong, which declined by 4.84 percent since last Friday amid a volatile five trading days.
- The poorest performing sector in Hong Kong’s Hang Seng Composite Index this week was consumer services, which tumbled 6.87 percent.
- Industrial profits at Chinese companies dropped 3.1 percent year-over-year for the June measurement period, Bloomberg News reported this week, noting that, “Factories are under stress from slowing global demand, higher tariffs and pressure on profitability from the resurgence of deflationary risks in producer prices.”
Opportunities
- If the trade talks now slated for September between the United States and China indeed proceed and produce fruit, then that would indeed represent a solid collective opportunity. But now, as before, the outcome is far from certain, and neither is the timeframe. At present, talks are still on for September following high-level talks in Shanghai this week between the U.S. and Chinese sides. President Trump is currently taking the stance that he is dissatisfied with the (lack of) progress, and announced he will be raising tariffs to 10 percent in September. He also announced these could be “temporary” and expressed optimism that the Chinese do indeed want a deal. It’s a lot to take in, and a busy, headline-ish week, but as long as the talks are still on, there is an important element of possibility for some resolution or at least more certainty in the future.
- Despite multiple missile launches in recent days, the U.S. and North Korea are apparently still working on setting up another round of talks soon.
- Vietnam’s export growth jumped handily to a 9.3 percent year-over-year pace for the July measurement period, ahead of the prior reading of 8.5 percent and solidly ahead of estimates for only 7.3 percent growth.
Threats
- The threat of U.S.-China trade war escalation must remain a threat until resolved with more certainty. And note, that while there had indeed been some signs of progress over the past months, delays in implementation of tariffs, for example, heading into the Osaka G20, or the talks still currently slated for September, much of that progress seems to have eroded over the past week as implementation of 10 percent tariffs on the remaining $300 billion of Chinese imports to the U.S. is now slated for September as well, per President Trump, with China threatening countermeasures and stating that North Korean talks could also be in jeopardy now. President Trump, who did make sure to call China’s Xi Jinping his “friend,” nonetheless announced that the Chinese have (allegedly) not followed through on terms, and U.S. officials have explained that President Trump is dissatisfied with the progress from the talks, and so is ratcheting up tariffs. Larry Kudlow did announce that good things can happen in a month, but the tariffs are now set to go up. And all the while in the background, the Chinese renminbi is rising (weakening) of late, climbing (falling) to 6.9405 by Friday. As usual, stay tuned…

- Unrest continued in Hong Kong, as police fired tear gas and rubber bullets at protesters over the past week and with additional protests on tap for this weekend.
- Vietnam will need to take additional steps to narrow its trade surplus with the United States, a busy U.S. Trade Representative Robert Lighthizer reiterated this week.
Blockchain and Digital Currencies
Strengths
- Of the cryptocurrencies tracked by CoinMarketCap, the best performing for the week ended August 2 was Proton Token, up 568.01 percent. Bitcoin also jumped back this week, up to $10,500 as expected, looking set to test key resistance at $11,120 over the weekend, writes CoinDesk.
- Bitcoin’s three-day chart is showing a golden cross, which is a long-term indicator, for the first time since February 2016, reports CoinDesk. With a similar crossover seen six months ahead of the August 2016 mining reward halving paving the way for a mega bull run, the article explains, history could repeat itself with mining reward halving due in less than 12 months.
- Bitcoin lightning wallets are gaining traction this year, reports CoinDesk, which is making small transactions affordable by reducing network fees. In fact, startup Bluewallet garnered 35,000 downloads so far this year, a significant jump from the 5,000 users it had in 2018. “The things we are working on now are to prepare the wallet for the next bull run,” Bluewallet co-founder Nuno Coelho said. “To allow users to have more control over the fees when the market will be with higher fees.”
Weaknesses
- Of the cryptocurrencies tracked by CoinMarketCap, the best performing for the week ended August 2 was BQT, down 86.94 percent.
- Facebook’s Libra cryptocurrency may never launch, reads a headline on CoinDesk this week. The social media company has acknowledged what many have been saying – that regulatory issues may be an insurmountable barrier to the launch of its Libra global project, the article continues. In Facebook’s latest quarterly report to the U.S. Securities and Exchange Commission (SEC), it admits that with many barriers facing Libra “there can be no assurance that Libra or our associated products and services will be made available in a timely manner, or at all.”
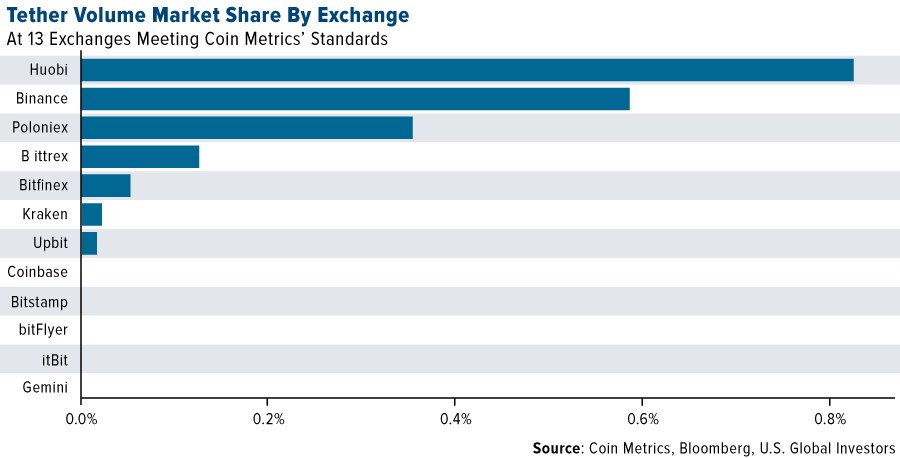
- “One of the murkier corners of the cryptocurrency market is becoming even less transparent,” writes Bloomberg. Tether is slowing becoming a means for conducting transactions on a spate of new blockchains, the article explains, and the migration from the dominant bitcoin and Ethereum platforms risks making it more difficult for investors to track transactions. “Tether has historically enjoyed obfuscation,” co-founder of Blockspur said. “With them being on different blockchains, it’s harder to figure out what’s going on.”
Opportunities
- Blockchain.com, which has created more than 40 million digital-asset wallets, is moving into the trading side of cryptocurrencies with a new exchange, writes Bloomberg. A London-based marketplace called The Pit will offer Bitcoin, Ether, Bitcoin Cash, Tether, Litecoin and Paxos. Trading begins soon and customers will be able to deposit funds immediately.
- Data storage giant Seagate, in partnership with IBM, is moving a blockchain-based product tracking trial to the pilot stage. The project monitors products sent via several steps to the customer. Any product returns are also tracked back to Seagate. “In a real-world offering, this would help ensure that counterfeit drives are not sent back in place of the genuine article,” the article explains.
- Cryptocurrency exchange FTX has “perhaps the most speculative and oddly-named futures index fund on the market: SHIT-PERP, or the Shitcoin Index Perpetual Futures,” writes CoinDesk. The index is comprised of 58 low-market cap coins, including Waves, Grin and Nano.
Threats
- As reported by CoinDesk, the Russian Federal Customs Service has opened a criminal investigation into an importer of bitcoin miners for potential underpayment of customs fees. A search warrant shows the Far-East Trading and Industrial Company (DTPK) as failing to pay around $1.2 million on 6,012 Bitmain-manufactured ASIC miners imported from August 2017 to February 2018.
- “Bitcoin holders can’t escape the IRS,” reads one MarketWatch headline this week. As the article explains, although bitcoin is the currency that no government controls, the government still collects taxes on it. Scrutiny is about to increase on taxpayers’ crypto gains by the IRS. In fact, the IRS has begun sending letters to more than 10,000 taxpayers asking them to assert that they’ve paid all the taxes on their digital currency gains, the article continues.
- LedgerX, a bitcoin derivatives provider, announced Wednesday that it has launched the first physically-settled bitcoin futures contracts in the U.S., reports CoinDesk. However, contrary to the company’s claims, on Thursday’s the U.S. Commodities Futures Trading Commission (CFTC) says LedgerX has “not yet been approved by the Commission to launch “physical” bitcoin futures.

Leaders and Laggards
| Index | Close | Weekly Change($) |
Weekly Change(%) |
|---|---|---|---|
| S&P/TSX Global Gold Index | 237.04 | +2.89 | +1.23% |
| Gold Futures | 1,452.80 | +20.60 | +1.44% |
| Natural Gas Futures | 2.14 | -0.03 | -1.52% |
| S&P/TSX VENTURE COMP IDX | 595.74 | +2.85 | +0.48% |
| 10-Yr Treasury Bond | 1.84 | -0.23 | -11.01% |
| Nasdaq | 8,004.07 | -326.14 | -3.92% |
| Oil Futures | 55.22 | -0.98 | -1.74% |
| Hang Seng Composite Index | 3,598.05 | -183.02 | -4.84% |
| S&P 500 | 2,932.05 | -93.81 | -3.10% |
| DJIA | 26,485.01 | -707.44 | -2.60% |
| Korean KOSPI Index | 1,998.13 | -68.13 | -3.30% |
| Russell 2000 | 1,533.66 | -45.31 | -2.87% |
| S&P Energy | 445.85 | -15.61 | -3.38% |
| S&P Basic Materials | 359.06 | -11.05 | -2.99% |
| XAU | 90.82 | +0.17 | +0.19% |
| Index | Close | Monthly Change($) |
Monthly Change(%) |
|---|---|---|---|
| Natural Gas Futures | 2.14 | -0.15 | -6.72% |
| S&P/TSX Global Gold Index | 237.04 | +16.31 | +7.39% |
| 10-Yr Treasury Bond | 1.84 | -0.11 | -5.54% |
| Oil Futures | 55.22 | -2.12 | -3.70% |
| Gold Futures | 1,452.80 | +19.90 | +1.39% |
| S&P 500 | 2,932.05 | -63.77 | -2.13% |
| S&P Energy | 445.85 | -20.48 | -4.39% |
| Hang Seng Composite Index | 3,598.05 | -239.51 | -6.24% |
| DJIA | 26,485.01 | -480.99 | -1.78% |
| Korean KOSPI Index | 1,998.13 | -97.89 | -4.67% |
| Nasdaq | 8,004.07 | -166.16 | -2.03% |
| S&P Basic Materials | 359.06 | -11.96 | -3.22% |
| Russell 2000 | 1,533.66 | -38.46 | -2.45% |
| S&P/TSX VENTURE COMP IDX | 595.74 | +9.58 | +1.63% |
| XAU | 90.82 | +6.77 | +8.05% |
| Index | Close | Quarterly Change($) |
Quarterly Change(%) |
|---|---|---|---|
| Natural Gas Futures | 2.14 | -0.45 | -17.50% |
| 10-Yr Treasury Bond | 1.84 | -0.70 | -27.50% |
| DJIA | 26,485.01 | +177.22 | +0.67% |
| Oil Futures | 55.22 | -6.59 | -10.66% |
| S&P 500 | 2,932.05 | +14.53 | +0.50% |
| Gold Futures | 1,452.80 | +162.90 | +12.63% |
| S&P Energy | 445.85 | -24.69 | -5.25% |
| Nasdaq | 8,004.07 | -32.70 | -0.41% |
| Korean KOSPI Index | 1,998.13 | -214.62 | -9.70% |
| S&P Basic Materials | 359.06 | +7.75 | +2.21% |
| Russell 2000 | 1,533.66 | -48.99 | -3.10% |
| Hang Seng Composite Index | 3,598.05 | -402.87 | -10.07% |
| S&P/TSX Global Gold Index | 237.04 | +59.35 | +33.40% |
| S&P/TSX VENTURE COMP IDX | 595.74 | -5.54 | -0.92% |
| XAU | 90.82 | +22.57 | +33.07% |
U.S. Global Investors, Inc. is an investment adviser registered with the Securities and Exchange Commission ("SEC"). This does not mean that we are sponsored, recommended, or approved by the SEC, or that our abilities or qualifications in any respect have been passed upon by the SEC or any officer of the SEC.
This commentary should not be considered a solicitation or offering of any investment product.
Certain materials in this commentary may contain dated information. The information provided was current at the time of publication.
Some links above may be directed to third-party websites. U.S. Global Investors does not endorse all information supplied by these websites and is not responsible for their content.
Holdings may change daily. Holdings are reported as of the most recent quarter-end. The following securities mentioned in the article were held by one or more accounts managed by U.S. Global Investors as of (06/30/2019):
Mosaic Co.
OMV Petrom SA
Gazprom PJSC
Resolute Mining Ltd
Boeing Co/The
*The above-mentioned indices are not total returns. These returns reflect simple appreciation only and do not reflect dividend reinvestment.
The Dow Jones Industrial Average is a price-weighted average of 30 blue chip stocks that are generally leaders in their industry.
The S&P 500 Stock Index is a widely recognized capitalization-weighted index of 500 common stock prices in U.S. companies.
The Nasdaq Composite Index is a capitalization-weighted index of all Nasdaq National Market and SmallCap stocks.
The Russell 2000 Index® is a U.S. equity index measuring the performance of the 2,000 smallest companies in the Russell 3000®, a widely recognized small-cap index.
The Hang Seng Composite Index is a market capitalization-weighted index that comprises the top 200 companies listed on Stock Exchange of Hong Kong, based on average market cap for the 12 months.
The Taiwan Stock Exchange Index is a capitalization-weighted index of all listed common shares traded on the Taiwan Stock Exchange.
The Korea Stock Price Index is a capitalization-weighted index of all common shares and preferred shares on the Korean Stock Exchanges.
The Philadelphia Stock Exchange Gold and Silver Index (XAU) is a capitalization-weighted index that includes the leading companies involved in the mining of gold and silver.
The U.S. Trade Weighted Dollar Index provides a general indication of the international value of the U.S. dollar.
The S&P/TSX Canadian Gold Capped Sector Index is a modified capitalization-weighted index, whose equity weights are capped 25 percent and index constituents are derived from a subset stock pool of S&P/TSX Composite Index stocks.
The S&P 500 Energy Index is a capitalization-weighted index that tracks the companies in the energy sector as a subset of the S&P 500.
The S&P 500 Materials Index is a capitalization-weighted index that tracks the companies in the material sector as a subset of the S&P 500.
The S&P 500 Financials Index is a capitalization-weighted index. The index was developed with a base level of 10 for the 1941-43 base period.
The S&P 500 Industrials Index is a Materials Index is a capitalization-weighted index that tracks the companies in the industrial sector as a subset of the S&P 500.
The S&P 500 Consumer Discretionary Index is a capitalization-weighted index that tracks the companies in the consumer discretionary sector as a subset of the S&P 500.
The S&P 500 Information Technology Index is a capitalization-weighted index that tracks the companies in the information technology sector as a subset of the S&P 500.
The S&P 500 Consumer Staples Index is a Materials Index is a capitalization-weighted index that tracks the companies in the consumer staples sector as a subset of the S&P 500.
The S&P 500 Utilities Index is a capitalization-weighted index that tracks the companies in the utilities sector as a subset of the S&P 500.
The S&P 500 Healthcare Index is a capitalization-weighted index that tracks the companies in the healthcare sector as a subset of the S&P 500.
The S&P 500 Telecom Index is a Materials Index is a capitalization-weighted index that tracks the companies in the telecom sector as a subset of the S&P 500.
The NYSE Arca Gold Miners Index is a modified market capitalization weighted index comprised of publicly traded companies involved primarily in the mining for gold and silver.
The Consumer Price Index (CPI) is one of the most widely recognized price measures for tracking the price of a market basket of goods and services purchased by individuals. The weights of components are based on consumer spending patterns.
The Purchasing Manager’s Index is an indicator of the economic health of the manufacturing sector. The PMI index is based on five major indicators: new orders, inventory levels, production, supplier deliveries and the employment environment.
The S&P/TSX Venture Composite Index is a broad market indicator for the Canadian venture capital market. The index is market capitalization weighted and, at its inception, included 531 companies. A quarterly revision process is used to remove companies that comprise less than 0.05% of the weight of the index, and add companies whose weight, when included, will be greater than 0.05% of the index.
Gross domestic product (GDP) is the monetary value of all the finished goods and services produced within a country’s borders in a specific time period, though GDP is usually calculated on an annual basis. It includes all of private and public consumption, government outlays, investments and exports less imports that occur within a defined territory.
The STOXX Europe 600 Index is derived from the STOXX Europe Total Market Index (TMI) and is a subset of the STOXX Global 1800 Index. With a fixed number of 600 components, the STOXX Europe 600 Index represents large, mid and small capitalization companies across 18 countries of the European region. Formerly known as Dow Jones-UBS Commodity Spot Index (DJUBSSP), the index measures the price movements of commodities included in the Bloomberg CI and select subindexes. The London Metals Exchange Index (LMEX) is a weighted index of six, designated, primary metals which include: Primary Aluminum, Zinc, Nickel, Lead, Copper and Tin. A bond’s credit quality is determined by private independent rating agencies such as Standard & Poor’s, Moody’s and Fitch. Credit quality designations range from high (AAA to AA) to medium (A to BBB) to low (BB, B, CCC, CC to C). The Chicago Business Barometer is a weighted composite indicator made up of five sub-indicators, namely New Orders, Production, Employment, Order Backlogs and Supplier Deliveries. It is designed to predict future changes in gross domestic product (GDP). The Michigan Consumer Sentiment Index (MCSI) is a monthly survey of U.S. consumer confidence levels conducted by the University of Michigan. It is based on telephone surveys that gather information on consumer expectations regarding the overall economy. The labor force participation rate measures an economy’s active labor force and is the sum of all employed workers divided by the working age population. It refers to the number of people who are either employed or are actively looking for work. A basis point, or bp, is a common unit of measure for interest rates and other percentages in finance. One basis point is equal to 1/100th of 1%, or 0.01% (0.0001).

