


Which Resource Areas Show Signs of Strength?
Date Posted: May 16, 2014
Read time: 39 min
Press Release:
U.S. Global Investors Reports Results for the Third Quarter of 2014 Fiscal Year
Note:
This week’s podcast recording will be available on Monday. We apologize for any inconvenience.
By Frank Holmes
CEO and Chief Investment Officer
U.S. Global Investors
 |
Global synchronized growth, as measured by the Global Purchasing Managers’ Index (PMI), remained stable or positive for the past 12 months until Japan reversed the momentum in April with a precipitous drop in its PMI. China is contributing modest growth but, fortunately, the U.S. and Europe are rebounding. This lack of consistent global momentum has created a short-term, volatile, hot and cold, stop-and-go sentiment. Global real GDP growth peaked in 2010 at 5.2 percent then slowed for the next three years to 3 percent. Global growth in 2014 is likely to accelerate, for the first time in four years, to 3.5 percent, according to ISI. This is constructive news for commodities.
Brian Hicks and I co-manage the Global Resources Fund (PSPFX) using a model that focuses on companies demonstrating robust fundamentals in sectors showing strength. I’ve asked Brian to share his thoughts on the opportunities we see in today’s market.
Q: We’ve seen strength in the major oil companies, service and equipment companies, oil and gas exploration and production (E&P) companies, chemical companies and refiners. What’s behind the strength?
A: The major oil companies have benefited from higher Brent pricing and cheap relative valuation to energy and the broader market. E&P stocks are especially solid because the price of oil is strong. The shale revolution has been a transformative factor for a lot of companies in this space, creating very strong growth in production. Chemical companies and refiners are downstream beneficiaries of the shale play as relatively inexpensive oil and natural gas prices lower their main input cost in the manufacturing of chemicals and refined petroleum products. Because of this competitive advantage in the U.S., we’re seeing chemical companies moving back to the states and creating jobs. Global demand is also increasing for oil and chemicals.

Q: Other commodities such as copper, aluminum and iron ore have been struggling. The Brent oil price hasn’t moved as much as the WTI price. Explain what is happening in these areas.
A: Brent oil isn’t necessarily struggling, but it has been stuck in a sideways trading pattern. Copper prices have fallen hard and subsequently rebounded recently. The metal has experienced a lot of volatility as well. This is mainly due to soft economic growth in China and high inventory levels in global exchanges. Aluminum and iron ore are both oversupplied and the glut has weighed on prices. Until we see cutbacks in production and prices that support profit, they will likely remain weak. Australian iron ore producers have cranked up production to the point where 2014 will likely remain a year of oversupply.
Q: Talk about some of the recent “success story” stocks in the fund.
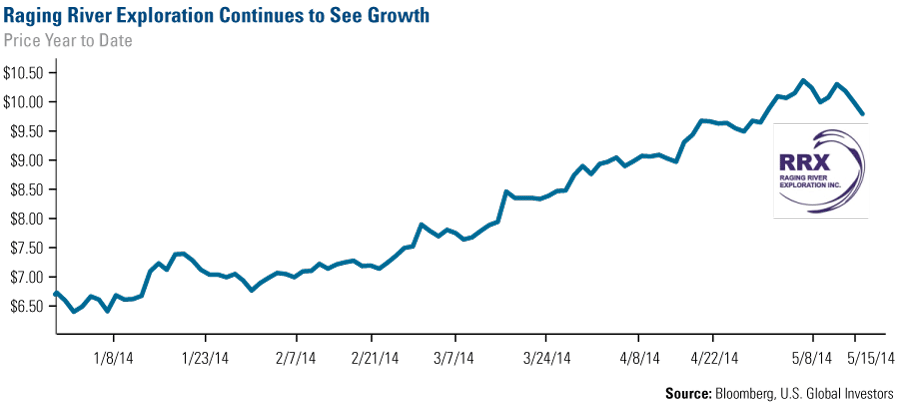
A: Raging River Exploration is a Canadian junior oil and gas producer. The company has a deep inventory of drilling prospects, strong netbacks (the gross profit per barrel of oil produced), and has seen rising profit growth. We bought this name on a price pull back.
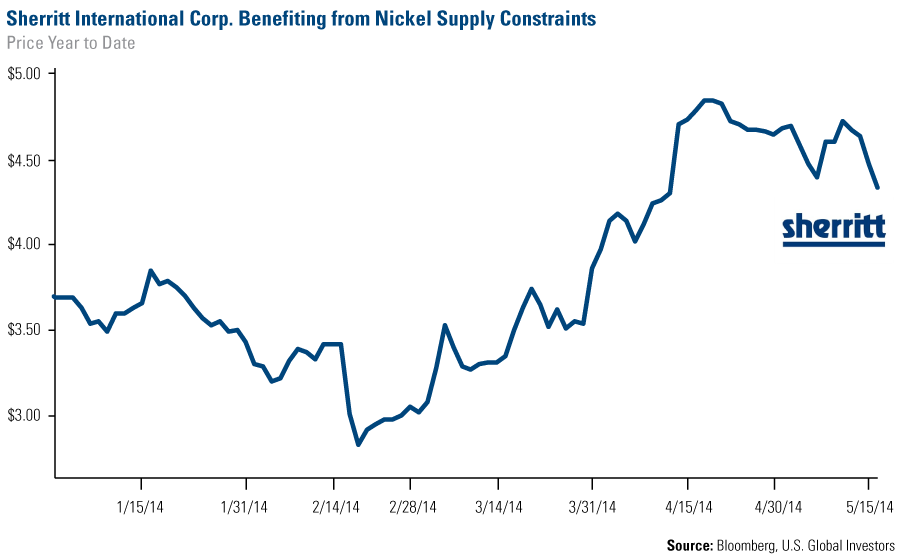
Sherritt International Corp is another Canadian based resource company. It has interests in nickel, coal and cobalt mining. Nickel prices were under tremendous pressure last year due to oversupply but have surged this year since Indonesia banned exports of unprocessed ore in an effort to encourage domestic industrial development. Indonesia is the world’s leading supplier of high-grade nickel ore, which is used to make stainless steel. Sherritt has benefitted from this drastic change in the nickel market.
Goodrich Petroleum Corp is an exploration and production company that looks for natural gas and crude oil. The company has had positive drill results recently in a developing new play, the Tuscaloosa Marine Shale in Louisiana and Mississippi. We first bought the stock around $14. Today it is trading around $24.

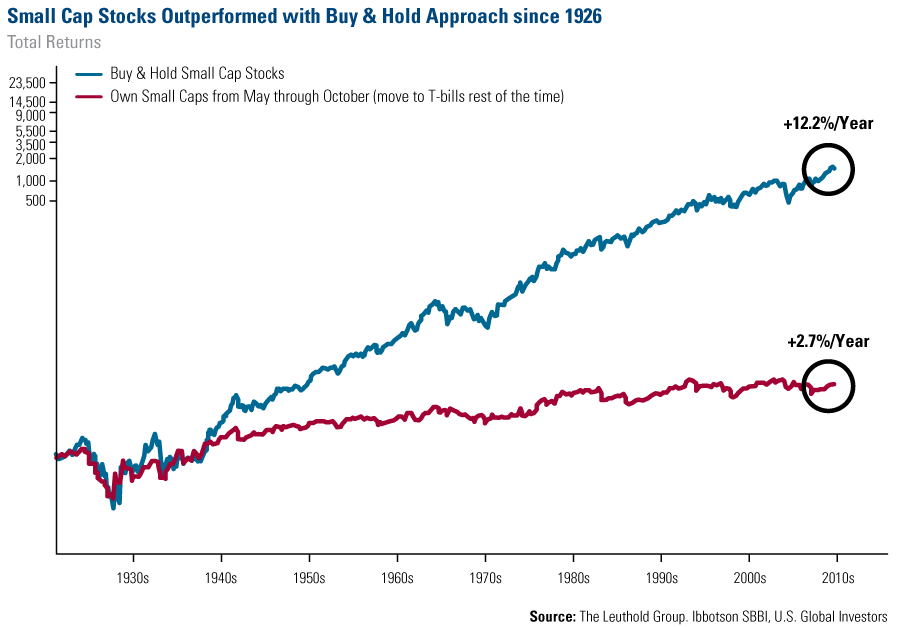
Q: Recently the overall market sentiment has shifted to prefer large cap companies over small cap stocks. Why do you still believe in small caps for the long term?
A: Small caps are where the growth is going to come from, and this is true of resource companies as well. These types of stocks may be out of favor for the time being, but in the stock market everything is cyclical. Eventually, the market will recognize (again) that smaller companies have higher growth potential and the sentiment will shift back.
Going back to 1926, small cap stocks have historically performed better from November through April. Check out the difference between a buy and hold strategy and one where small cap were held during the May-to-October period.
Vancouver is a lovely summer destination and the perfect place to learn more about resource investing. I’ll be speaking there at the Natural Resource Symposium July 22-25. I hope to see you there.

Index Summary
- Major market indices finished mixed this week. The Dow Jones Industrial Average fell 0.55 percent. The S&P 500 Stock Index dropped 0.03 percent, while the Nasdaq Composite gained 0.46 percent. The Russell 2000 small capitalization index declined 0.39 percent this week.
- The Hang Seng Composite rose 3.42 percent; Taiwan fell by a very modest 0.01 percent while the KOSPI advanced 2.91 percent.
- The 10-year Treasury bond yield fell 10 basis points to finish the week at 2.52 percent.

Domestic Equity Market
The S&P 500 Index ended the week essentially flat for the week. The market rallied early in the week but couldn’t maintain the momentum and reversed course. The Russell 2000 continued its recent string of underperformance, once again highlighting the bifurcation in the market.

Strengths
- The telecommunication services sector was the best performer for the third week in a row as AT&T and Verizon both rose by roughly one percent. It was announced this week that some high profile billionaire investors have recently bought stakes in Verizon, including Warren Buffett, Daniel Loeb and John Paulson.
- The technology sector also had a good week as Cisco Systems rose nearly 6 percent on better than expected quarterly earnings results. Applied Materials was another standout performer, rising 4.7 percent, also on better than expected earnings results. Disk drive makers Western Digital and Seagate Technology also were standout performers as the stocks rebounded from recent weakness and Western Digital announced a substantial dividend increase.
- Nordstrom was the best performer in the S&P 500, rising 14.77 percent this week. The company released fiscal first-quarter results which were roughly in line with year ago performance, but beat current expectations on better outlet and online sales.
Weaknesses
- The financial sector was the worst performer this week as the group experienced broad-based weakness. Banks, insurance and discount brokers led on the downside. Charles Schwab and E*Trade both fell about 5 percent after posting disappointing trading activity in their monthly updates.
- The energy sector was a weak performer in what appears to be a normal pullback after a period of outperformance. Chesapeake Energy fell by more than 7 percent as the company cut its output growth estimate for the year.
- Fossil Group was the worst performer in the S&P 500, falling 7.84 percent. The company announced disappointing quarterly results, driven by weakness in handbag and leather goods. Same store sales were disappointing, falling 2.4 percent year-over-year.
Opportunities
- Retailers have begun reporting, with several including TJX, Home Depot, Lowes and Target all reporting next week. The consumer discretionary sector has underperformed recently, potentially setting up a scenario where expectations are sufficiently low that stocks could rally on decent results.
- Next week, new and existing home sales for May will be released and after this week’s strong housing starts data, it could be a catalyst for housing-related stocks.
- The selloff in high quality companies offers an opportunity to pick up companies with robust fundamentals at attractive prices.
Threats
- The Russell 2000 has broken below its 200-day moving average for the first time since November 2012. This could potentially be an early sign of a broader market correction in the works.
- The flip side of the retailers reporting next week is that if earnings disappoint, this could signal broader problems in the economy and lead to a growth scare among investors after disappointing GDP data out of Europe this week.
- Chinese economic data continues to disappoint and while some stimulus measures have been introduced, China remains a threat to the global growth outlook.

The Economy and Bond Market
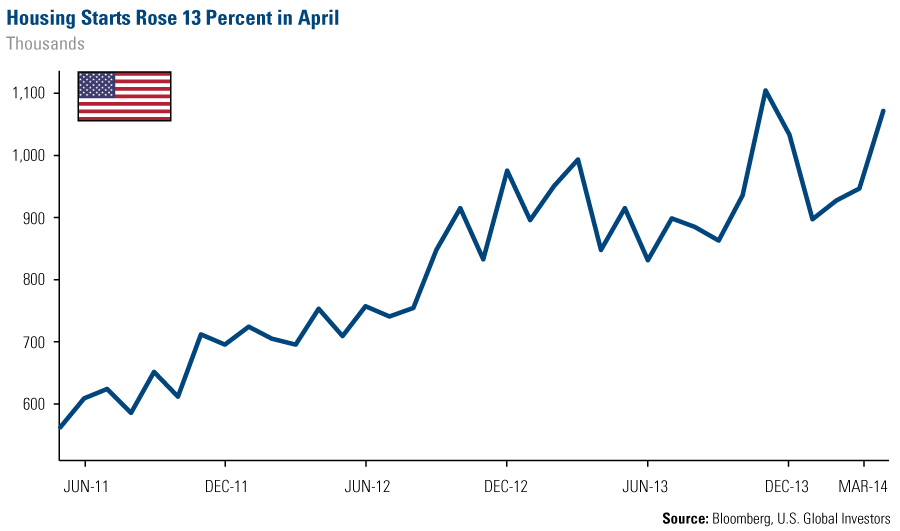
Treasury bond yields fell this week with the long end of the yield curve experiencing a significant rally. The 30-year Treasury is at the lowest levels since June 2013 as euro area economic data was weaker than expected, deflation concerns have reemerged, and the European Central Bank (ECB) is likely to ease monetary policy in June. U.S. fixed income has also become relatively attractive as 10-year European periphery bonds are yielding less than 3 percent, with many long-term challenges still ahead of them. Housing starts here in the U.S. crossed back above the 1 million annualized unit level and have been steadily climbing for the past several years. Some analysts were concerned with the underlying composition of the data, as virtually all the growth was from multi-family units, which are not viewed as favorably as single family starts. The key takeaway is that activity is picking up right on schedule and housing will be an important component of the economic expansion in 2014.
Strengths
- Housing starts and building permits both eclipsed 1 million annualized units in April. If housing can resume its recovery, that would be a very positive development for overall economic activity.
- The National Federation of Independent Business (NFIB) optimism index, which measures small business confidence, rose to the highest level since the financial crisis and has risen for seven months in a row.
- The Bundesbank (German Central Bank) endorsed the idea of monetary easing by the ECB, clearing a potential roadblock.
Weaknesses
- European GDP data was weaker than expected as EU GDP rose 0.9 percent, which was below expectations. Italy contracted slightly and France showed no growth.
- International economic data was skewed toward weakness this week as data out of China disappointed and Germany’s ZEW business confidence index fell sharply in May.
- Retail sales here in the U.S. were weaker than expected, rising just 0.1 percent after March data was revised higher. This was somewhat surprising as the early indications were generally better than expected and highlights the risks to the expansion.
Opportunities
- Bond yields have broken below their recent range. This often indicates a new equilibrium could be established at a lower level, allowing bonds to continue to rally from here.
- The President of the ECB, Mario Draghi suggested the ECB may ease monetary policy in June in response to the strong euro and low inflation.
- There are many moving parts to the taper decision and while the Federal Reserve began the process, it is very possible that tapering could be delayed if the economy stumbles.
Threats
- Long-term bonds have posted strong returns so far year to date and with economic data looking supportive, a modest sell off wouldn’t be surprising.
- Trade and/or currency “wars” cannot be ruled out which may cause unintended consequences and volatility in the financial markets.
- China remains a wildcard for economic recovery and the economy has shown some cracks in recent months. This is similar to how last year started and China found its footing. Something similar needs to happen this time around.

World Precious Minerals Fund – UNWPX • Gold and Precious Metals Fund – USERX
Gold Market
For the week, spot gold closed at $1,293.46, up $4.67 per ounce, or 0.36 percent. Gold stocks, as measured by the NYSE Arca Gold Miners Index, declined 1.30 percent. The U.S. Trade-Weighted Dollar Index rose 0.19 percent for the week.
| Date | Event | Survey | Actual | Prior |
|---|---|---|---|---|
| May 9-15 | China Money Supply M2 | 12.2% | 13.2% | 12.1% |
| May 14 | Japan GDP 1Q Preliminary | 4.2% | 5.9% | 0.7% |
| May 14 | Germany Consumer Price Index | 1.3% | 1.3% | 1.3% |
| May 15 | U.S. Consumer Price Index | 2.0% | 2.0% | 1.5% |
| May 21 | China HSBC Flash Manuf. PMI | 48.3 | – | 48.1 |
| May 21 | FOMC April Meeting Minutes | – | – | – |
| May 22 | Eurozone Markit Flash Manuf. PMI | 53.2 | – | 53.4 |
| May 23 | U.S. April New Home Sales | 420K | – | 384K |
Strengths
- U.S. inflation has undoubtedly picked up, and is likely to rise toward the Federal Reserve’s target. A number of important inflation readings outpaced the official U.S. Consumer Price Index (CPI) this week: (1) services inflation rose 2.5 percent; (2) food prices have risen more than 10 percent year to date; and (3) core import prices are rising, thus abating the deflationary impact they had over the past two years. In addition, Treasury Inflation-Protected Securities (TIPS) have been rising since the beginning of the year, and really spiked this month, in anticipation of higher inflation. This recent move lower in real yields has not yet been transmitted into higher gold prices.

- Palladium climbed to the highest price since August 2011, and 15 percent year to date, as concerns mounts over supply restrictions in South Africa. Meanwhile, the Russian government has moved to purchase palladium from local producers, with markets speculating the country’s Gokhran palladium stockpiles are near exhaustion. On a similar note, platinum demand is expected to increase 35 percent this year in India alone as local jewelers seek to replace the volumes lost when gold import curbs took effect.
- Balmoral Resources announced drill results at the Bug Lake footwall at its Martiniere property in Quebec, with intercepts as high as 1,138 grams per tonne over five meters. The stock surged over 20 percent intraday as there remains significant expansion potential at Martiniere. Similarly, Rio Alto Mining reported assay results at La Arena showing the size and life of the oxide resource around the Calaorco Pit is likely to increase, thus allowing the company to pursue the proposed Phase II expansion of its flagship project.
Weaknesses
- Chinese gold and silver jewelry sales fell 30 percent in April, according to the National Bureau of Statistics. However, as Macquarie analysts pointed out, the year-over-year comparison is misleading due to the fact that April 2013 was an exceptional month for gold jewelry sales as gold prices dropped over $100 per ounce.
- Ivanhoe Mines, which holds controlling interests in the Platreef platinum deposit in South Africa and the Kamoa copper and Kipushi zinc mines in the Democratic Republic of Congo, dropped 16 percent on Thursday after it announced it will require further funding by the end of June to continue with its development plans. Despite the known potential and attractiveness of these three projects, the sources of financing are uncertain at a time when investors have been reluctant to fund exploration and development projects.
- South African’s National Union of Mineworkers (NUM) announced that two of its members were killed as they reported to work at Lonmin’s platinum mine. The attack occurred as Lonmin sidestepped the AMCU union and made an offer to miners directly in a bid to end a four-month long platinum workers strike. Lonmin’s employees unaffiliated with the AMCU have been reportedly subject to intimidation and assaults.
Opportunities
- A Bloomberg report shows China is on pace to import two-thirds of non-Chinese mined gold production as demand rises 31 percent. China is expected to import more than 1.45 million kilograms this year, while gold supply is not expected to change materially in 2014 from 2.3 million kilograms in 2013. Going forward, China’s dependence on foreign gold is likely to increase given that gold reserves in China are made up of small- to medium-sized deposits of low-grade ore.
- Barclays’ North America precious metals analysts are optimistic on the gold space following the earnings’ wrap-up this week. According to Barclays, the large number of earnings’ beats, together with reiterated or raised guidance, show that the pendulum “swung too far.” In general terms, there was broad outperformance industry-wide in the first quarter, possibly marking the beginning of a new cycle of rising expectations. Companies like Agnico Eagle Mines, Mandalay Resources, and OceanaGold showed the investing community that there is plenty of value in gold stocks, even after the drop in gold prices.
- Australia’s Northern Star Resources is poised to become the second largest miner in the country following the recent acquisition of Newmont’s Jundee mine. The acquisition is expected to bring Northern Star’s production up from 350,000 ounces to 550,000 ounces. For a total consideration of $91 million, Northern Star will retain all of Newmont’s existing staff and equipment, thus allowing the company to increase its free cash flow immediately. The company also expects to increase the asset’s resources through an exploration program around the mine.
Threats
- BofAML is of the opinion that the Chinese government’s focus on quality over quantity of growth is likely to result in short- and medium-term weakness by allowing selective defaults. Next week’s China HSBC Flash Manufacturing PMI will be an important indicator for gold. The PMI’s three-month average is sitting at 48.2, while analysts’ expectations call for a 48.3 reading. Any reading above this is likely to be perceived as contributing to the stabilization of the Chinese economy and should be bullish for gold as it indicates expectations of rising future incomes.
- ISI’s Weekly Economic Report suggests that its Diffusion Index of company surveys, which has been used as a leading indicator, has peaked in a way that resembles the “Sell in May’ peaks of the previous three years. As such, the Fed minutes for the April Federal Open Market Committee (FOMC) meeting to be released next Wednesday are likely to be the next catalyst for stocks and gold. Further to that, Friday’s new home sales report is of special importance given the sharp decline seen in March, which analysts are forecasting to be corrected by the April reading.
- India has announced it raised its benchmark import price for a number of commodities in an effort to stave off the appreciation of the Indian Rupee following the primary elections. The price benchmarks for gold and silver will be raised, which will result in small hikes to import tax bills.
May 16, 2014New Opportunities for an Ancient Culture |
May 12, 2014The Good, the Bad and the Opportunity |
May 6, 2014The Top Five Government Policies I’m Watching This Week |
Energy and Natural Resources Market

Strengths
- The price of West Texas Intermediate crude oil gained 3 percent this week on better economic data and further tension in the Ukraine.
- Rigs targeting oil and natural gas drilling in the U.S. rose by six this week to 1,861 according to Baker Hughes.
- China CISA mill members’ steel output hit a record high in early May. Crude steel output for the first 10 days of May rose 1.6 percent to 1.82 million metric tons versus the previous 10 days on cheaper iron ore. The benchmark Iron Ore Index stood at $103 per metric ton.
- Palladium hit a two-and-a-half-year high on supply concerns from South African mines, after the striking members did not allow returning workers to enter mines. Palladium rose to $827.5 per ounce this week, the highest level since August 2011.
Weaknesses
- Natural gas fell 2 percent this week to $4.42 per Mmbtu as mild temperatures in the Northeast weighed on demand.
- Uranium dropped to an eight-year low of $29 a pound on delays in restarting Japan’s nuclear reactors.
- Chinese stainless steel demand is weak at present, following a period of strong production growth (up 21 percent to 19.4 Mt in 2013). Few participants expect a recovery in stainless prices on a meaningful scale until well into 2015.
- The price of nickel on the London metals exchange fell over 4 percent this week after hitting a two-year high of $21,000 per metric ton on Tuesday.
Opportunities
- Rio Tinto’s Pilbara iron ore expansion is ahead of schedule. Rio has boosted its iron ore output to 290 million metric tons per year, two months earlier than expected, and is on track to hit its full expansion target of 360 million tons per year by 2017.
- Severstal put its North American operations up for sale, comprising two steel plants in Michigan and Mississippi, with an expected value of $1.5 billion. U.S. Steel is reportedly interested in the Michigan operations.
- China’s industrial output rose 8.7 percent in April year-over-year, and retail sales rose 11.9 percent, while fixed-asset investment rose 17.3 percent in the first four months from the same period last year, according to the National Bureau of Statistics.
Threats
- Australia’s iron ore exports face labor unrest as tugboat workers at Australia’s Port Headland port threaten to hold a strike that could halt a quarter of the world’s iron ore exports and cost miners $100 million per day.
- Russia’s foreign minister said Ukraine is sliding into a civil war that will make it impossible to hold legitimate elections, as Ukrainian leaders and their international allies blamed Russia for the violence.

China Region Fund – USCOX • Emerging Europe Fund – EUROX
Emerging Markets
Strengths
- Turkey’s current account deficit (CAD) declined to $3.2 billion this March, which compares favorably with the $5.6 billion deficit posted in March 2013, according to data released by the Turkish central bank. The 12-month trailing CAD fell sharply to 7.5 percent of GDP in March from 7.8 percent of GDP in February. Economists highlight a tightening in domestic demand and a favorable effect of economic recovery in the EU on Turkey’s exports.
- A string of preliminary GDP releases for the first quarter of the year kicked off in Europe this week. Hungary’s economy grew 3.5 percent from last year, handsomely beating economists’ expectations for 2.7 percent. Similarly, Poland reported 3.3 percent growth, ahead of forecasts for a 3.1 percent rise. The Hungarian numbers are supported by strong industrial production, as well as extraordinary job creation.
- An Erste Bank report estimates the benefits of EU membership have increased average growth in the V4 countries (Czech Republic, Hungary, Poland, and Slovakia) by approximately 1 percent annually. The estimate is based on benchmarking of the average growth of the V4 countries to some European countries at their earlier stage of income convergence.

Weaknesses
- The Center for European Economic Research (ZEW) suggested in its monthly bulletin that economic expectations for Germany have continued to worsen in May. The ZEW Indicator of Economic Sentiment decreased 10.1 points to 33.1 points, slightly above its historical average of 24.7 points. The decline suggests there are indications that Germany will not be able to maintain this fast pace of growth.
- The eurozone economy grew by just 0.2 percent in the first three months of 2014, only half as fast as expected. Germany outperformed with a 0.8 percent expansion, but most other countries faltered, with France stagnating, and Italy and Portugal contracting. Economists are urging the European Central Bank (ECB) to take action at next month’s meeting in order to prevent a further deceleration of Europe’s fragile recovery.
- China’s stocks fell midweek as slower-than-estimated growth in industrial output, retail sales, and fixed-asset investment increased concern the economic slowdown is deepening. Industrial production expanded 8.7 percent last month, missing the median estimate of analysts for 8.9 percent growth. Retail sales rose 11.9 percent in April, compared with the forecast for 12.2 percent growth. Fixed-asset investment climbed 17.3 percent, compared with the estimate for 17.7 percent growth.
Opportunities
- China’s major property developers rose strongly on news that the China Banking Regulatory Commission told banks to quicken home-loan approvals and loan distribution to stave off the recent decline in home sales. In April, home sales fell 18 percent according to the National Statistics Bureau data.
- The ECB is reportedly preparing a package of measures for its June meeting, including cuts in all its interest rates. According to Reuters, plans involve cutting the ECB deposit rate to a negative rate for the first time. The cut into negative territory will likely be part of a larger package that could also include a targeted long-term refinancing operation (LTRO), in an effort to boost bank liquidity to spur loan growth in the eurozone.
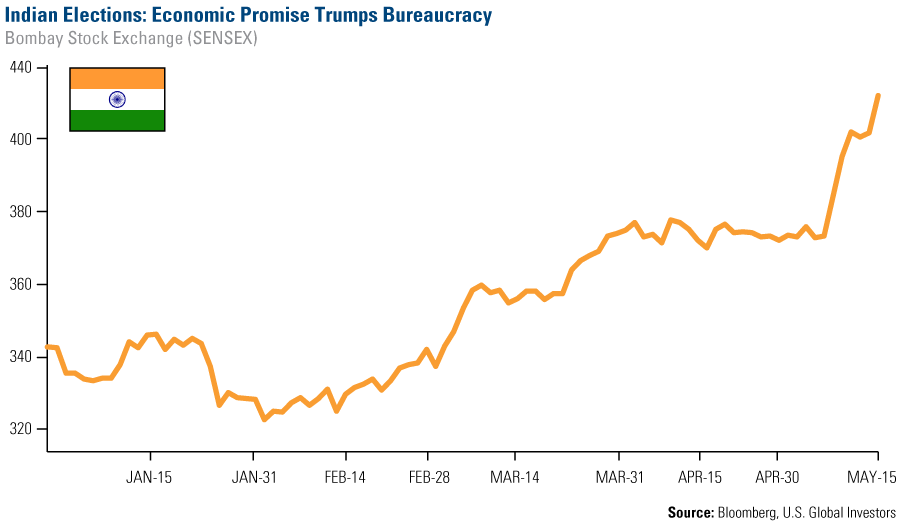
- The Bharatiya Janata Party (BJP) and Narendra Modi appear to be on the cusp of a historic victory in India’s election, with preliminary results showing a strong parliamentary majority. Investors have been keen on Modi’s platform, as evidenced by the $332 billion increase in value of Indian equities since the BJP named Narendra Modi as its candidate for prime minister last September. Foreign investors pushed bullish wagers in the options market, outnumbering bearish bets by the widest margin in 14 months, on expectations that Modi will fight bureaucracy and spur economic growth.
Threats
- Eurozone industrial output unexpectedly fell in March in what could point to slower economic growth going into the second quarter. This marked the first drop since August, and is attributed to a decline in energy production. Output in the euro countries dipped 0.1 percent as energy production dropped 11.9 percent on the back of a mild winter. Analysts had forecast a 1 percent rise in industrial production. European energy utilities are already feeling the pinch as electricity prices halved since the global economic crisis, exacerbated by a mild winter, and a rise in the use of renewable energy sources.
- Concerns over political instability seem to be harming the Greek market. PASOK, a member of the government’s coalition, has threatened to remove its support to the government if its affiliate party does not get enough votes in the European elections. Although this is highly unlikely, the coalition has a very slim majority that would be at stake if one of its members were to separate.
- Last week, the International Monetary Fund called on Dubai to take "stronger measures" to avert another property bubble, after property prices rocketed at a rate reminiscent of the 2009 crisis. Authorities in the Gulf emirate have already doubled sales fees to 4 percent, and the central bank of the United Arab Emirates has tightened lending facilities. The tightening may slow down the pace of gains seen in the gulf market over the past two years.

Leaders and Laggards
The tables show the weekly, monthly and quarterly performance statistics of major equity and commodity market benchmarks of our family of funds.
| Index | Close | Weekly Change($) |
Weekly Change(%) |
|---|---|---|---|
| Hang Seng Composite Index | 3,102.77 | +102.68 | +3.42% |
| Korean KOSPI Index | 2,013.44 | +56.89 | +2.91% |
| Oil Futures | 102.02 | +2.03 | +2.03% |
| Nasdaq | 4,090.59 | +18.72 | +0.46% |
| Gold Futures | 1,293.40 | +5.80 | +0.45% |
| S&P Basic Materials | 301.59 | +0.72 | +0.24% |
| S&P 500 | 1,877.86 | -0.62 | -0.03% |
| Russell 2000 | 1,102.91 | -4.31 | -0.39% |
| DJIA | 16,491.31 | -92.03 | -0.55% |
| XAU | 88.86 | -0.52 | -0.58% |
| S&P Energy | 681.13 | -4.22 | -0.62% |
| S&P/TSX Canadian Gold Index | 177.01 | -2.69 | -1.50% |
| Natural Gas Futures | 4.41 | -0.12 | -2.60% |
| 10-Yr Treasury Bond | 2.52 | -0.10 | -3.81% |
| Index | Close | Monthly Change($) |
Monthly Change(%) |
|---|---|---|---|
| S&P Basic Materials | 301.59 | +7.36 | +2.50% |
| S&P Energy | 681.13 | +15.58 | +2.34% |
| S&P 500 | 1,877.86 | +34.88 | +1.89% |
| DJIA | 16,491.31 | +228.75 | +1.41% |
| Nasdaq | 4,090.59 | +56.43 | +1.40% |
| Korean KOSPI Index | 2,013.44 | +21.17 | +1.06% |
| Gold Futures | 1,293.40 | -6.90 | -0.53% |
| Russell 2000 | 1,102.91 | -16.59 | -1.48% |
| Oil Futures | 102.02 | -1.73 | -1.67% |
| S&P/TSX Canadian Gold Index | 177.01 | -5.39 | -2.96% |
| XAU | 88.86 | -3.01 | -3.28% |
| Natural Gas Futures | 4.41 | -0.15 | -3.37% |
| 10-Yr Treasury Bond | 2.52 | -0.11 | -3.99% |
| Hang Seng Composite Index | 3,102.77 | -332.01 | -14.83% |
| Index | Close | Quarterly Change($) |
Quarterly Change(%) |
|---|---|---|---|
| S&P Energy | 681.13 | +54.02 | +8.61% |
| Korean KOSPI Index | 2,013.44 | +73.16 | +3.77% |
| S&P Basic Materials | 301.59 | +10.90 | +3.75% |
| S&P 500 | 1,877.86 | +39.23 | +2.13% |
| DJIA | 16,491.31 | +336.92 | +2.09% |
| Oil Futures | 102.02 | +1.72 | +1.71% |
| Hang Seng Composite Index | 3,102.77 | -19.23 | -0.62% |
| Gold Futures | 1,293.40 | -25.40 | -1.93% |
| Nasdaq | 4,090.59 | -153.44 | -3.62% |
| Russell 2000 | 1,102.91 | -46.31 | -4.03% |
| 10-Yr Treasury Bond | 2.52 | -0.22 | -8.02% |
| S&P/TSX Canadian Gold Index | 177.01 | -23.78 | -11.84% |
| XAU | 88.86 | -13.13 | -12.87% |
| Natural Gas Futures | 4.41 | -0.80 | -15.36% |
Please consider carefully a fund’s investment objectives, risks, charges and expenses. For this and other important information, obtain a fund prospectus by visiting www.usfunds.com or by calling 1-800-US-FUNDS (1-800-873-8637). Read it carefully before investing. Distributed by U.S. Global Brokerage, Inc.
All opinions expressed and data provided are subject to change without notice. Some of these opinions may not be appropriate to every investor.
Foreign and emerging market investing involves special risks such as currency fluctuation and less public disclosure, as well as economic and political risk. By investing in a specific geographic region, a regional fund’s returns and share price may be more volatile than those of a less concentrated portfolio.
The Emerging Europe Fund invests more than 25 percent of its investments in companies principally engaged in the oil & gas or banking industries. The risk of concentrating investments in this group of industries will make the fund more susceptible to risk in these industries than funds which do not concentrate their investments in an industry and may make the fund’s performance more volatile.
Because the Global Resources Fund concentrates its investments in a specific industry, the fund may be subject to greater risks and fluctuations than a portfolio representing a broader range of industries.
Gold, precious metals, and precious minerals funds may be susceptible to adverse economic, political or regulatory developments due to concentrating in a single theme. The prices of gold, precious metals, and precious minerals are subject to substantial price fluctuations over short periods of time and may be affected by unpredicted international monetary and political policies. We suggest investing no more than 5 percent to 10 percent of your portfolio in these sectors.
Bond funds are subject to interest-rate risk; their value declines as interest rates rise. Tax-exempt income is federal income tax free. A portion of this income may be subject to state and local income taxes, and if applicable, may subject certain investors to the Alternative Minimum Tax as well. The Near-Term Tax Free Fund may invest up to 20% of its assets in securities that pay taxable interest. Income or fund distributions attributable to capital gains are usually subject to both state and federal income taxes. The Near-Term Tax Free Fund may be exposed to risks related to a concentration of investments in a particular state or geographic area. These investments present risks resulting from changes in economic conditions of the region or issuer.
Investing in real estate securities involves risks including the potential loss of principal resulting from changes in property value, interest rates, taxes and changes in regulatory requirements.
Past performance does not guarantee future results.
Some link(s) above may be directed to a third-party website(s). U.S. Global Investors does not endorse all information supplied by this/these website(s) and is not responsible for its/their content.
These market comments were compiled using Bloomberg and Reuters financial news.
Fund portfolios are actively managed, and holdings may change daily. Holdings are reported as of the most recent quarter-end. Holdings as a percentage of net assets as of 3/31/14:
Raging River Exploration: Global Resources Fund, 1.21%
Sherritt International Corp.: Global Resources Fund, 1.24%
Goodrich Petroleum Corp.: Global Resources Fund, 1.13%
AT&T, Inc.: All American Equity Fund, 1.08%
Verizon Communications, Inc.: All American Equity Fund, 0.92%
Cisco Systems: 0.0%
Applied Materials: 0.0%
Western Digital: 0.0%
Seagate Technology: All American Equity Fund, 1.20%
Nordstrom, Inc.: 0.0%
Charles Schwab: All American Equity Fund, 0.47%; Holmes Macro Trends Fund, 0.51%
E*Trade: 0.0%
Chesapeake Energy: 0.0%
Fossil Group: 0.0%
TJX: 0.0%
Home Depot: All American Equity Fund, 0.95%
Lowes: 0.0%
Target: 0.0%
Balmoral Resources: World Precious Minerals Fund, 0.38%
Rio Alto Mining: Gold and Precious Metals Fund, 0.70%; World Precious Minerals Fund, 0.32%
Ivanhoe Mines: Global Resources Fund, 0.21%; World Precious Minerals Fund, 0.10%
Lonmin: 0.0%
Agnico Eagle Mines: Gold and Precious Metals Fund, 3.09%; World Precious Minerals Fund, 2.21%
Mandalay Resources Corp.: Global Resources Fund, 0.89%; Gold and Precious Metals Fund, 1.77%; World Precious Minerals Fund, 1.37%
OceanaGold: Gold and Precious Metals Fund, 2.52%; World Precious Minerals Fund, 1.65%
Northern Star Resources: Gold and Precious Metals Fund, 1.87%
Newmont Mining: Gold and Precious Metals Fund, 0.12%; World Precious Minerals Fund, 0.11%
Rio Tinto: Global Resources Fund, 0.29%
Sverstal: 0.0%
U.S. Steel: 0.0%
*The above-mentioned indices are not total returns. These returns reflect simple appreciation only and do not reflect dividend reinvestment.
The Dow Jones Industrial Average is a price-weighted average of 30 blue chip stocks that are generally leaders in their industry.
The S&P 500 Stock Index is a widely recognized capitalization-weighted index of 500 common stock prices in U.S. companies.
The Nasdaq Composite Index is a capitalization-weighted index of all Nasdaq National Market and SmallCap stocks.
The Russell 2000 Index® is a U.S. equity index measuring the performance of the 2,000 smallest companies in the Russell 3000®, a widely recognized small-cap index.
The Hang Seng Composite Index is a market capitalization-weighted index that comprises the top 200 companies listed on Stock Exchange of Hong Kong, based on average market cap for the 12 months.
The Taiwan Stock Exchange Index is a capitalization-weighted index of all listed common shares traded on the Taiwan Stock Exchange.
The Korea Stock Price Index is a capitalization-weighted index of all common shares and preferred shares on the Korean Stock Exchanges.
The Philadelphia Stock Exchange Gold and Silver Index (XAU) is a capitalization-weighted index that includes the leading companies involved in the mining of gold and silver.
The U.S. Trade Weighted Dollar Index provides a general indication of the international value of the U.S. dollar.
The S&P/TSX Canadian Gold Capped Sector Index is a modified capitalization-weighted index, whose equity weights are capped 25 percent and index constituents are derived from a subset stock pool of S&P/TSX Composite Index stocks.
The S&P 500 Energy Index is a capitalization-weighted index that tracks the companies in the energy sector as a subset of the S&P 500.
The S&P 500 Materials Index is a capitalization-weighted index that tracks the companies in the material sector as a subset of the S&P 500.
The S&P 500 Financials Index is a capitalization-weighted index. The index was developed with a base level of 10 for the 1941-43 base period.
The S&P 500 Industrials Index is a Materials Index is a capitalization-weighted index that tracks the companies in the industrial sector as a subset of the S&P 500.
The S&P 500 Consumer Discretionary Index is a capitalization-weighted index that tracks the companies in the consumer discretionary sector as a subset of the S&P 500.
The S&P 500 Information Technology Index is a capitalization-weighted index that tracks the companies in the information technology sector as a subset of the S&P 500.
The S&P 500 Consumer Staples Index is a Materials Index is a capitalization-weighted index that tracks the companies in the consumer staples sector as a subset of the S&P 500.
The S&P 500 Utilities Index is a capitalization-weighted index that tracks the companies in the utilities sector as a subset of the S&P 500.
The S&P 500 Healthcare Index is a capitalization-weighted index that tracks the companies in the healthcare sector as a subset of the S&P 500.
The S&P 500 Telecom Index is a Materials Index is a capitalization-weighted index that tracks the companies in the telecom sector as a subset of the S&P 500.
The NYSE Arca Gold Miners Index is a modified market capitalization weighted index comprised of publicly traded companies involved primarily in the mining for gold and silver.
The Consumer Price Index (CPI) is one of the most widely recognized price measures for tracking the price of a market basket of goods and services purchased by individuals. The weights of components are based on consumer spending patterns.
The Purchasing Manager’s Index is an indicator of the economic health of the manufacturing sector. The PMI index is based on five major indicators: new orders, inventory levels, production, supplier deliveries and the employment environment.

